How to make this specific "pileup" like plot?
Hi,
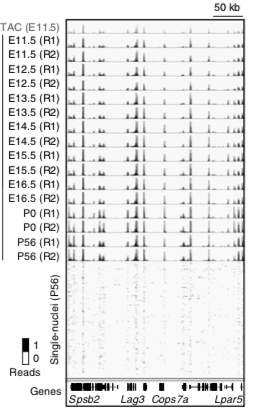
I came across this plot in the paper (2) that I'd like to know how to make. I have tried a couple of options, mainly through ggplot2, but none seem to yield an equivalent version --- specially the track at the bottom that appears to come from a binarized single-cell count matrix.
• 2,394 views
•
link
0 answers
No answers yet.
Log in to answer this question.
Why not contact the author directly? https://profiles.ucsd.edu/sebastian.preissl
I have.. though thought this will be faster..
You can try, but this group probably gets a lot of mail correspondance and will likely ignore questions about how to make a figure.
have you looked at Gviz?
I think this is simply a screenshot from the IGV browser, plus some custom things like the box and size scale and legend. Can do this with Inkscape.