Hello, I'm using deeptools computeMatrix/plotHeatmap, and am getting a large amount of missing data (i.e. black in the graph).
Commands used
The call to computeMatrix takes in ChIPseq peaks, and corresponding signal in bigWig format:
Command 1: computeMatrix
computeMatrix reference-point --referencePoint center -S file1.bw file2.bw file3.bw file4.bw -R peaks.bed -a 500 -b 500 -o matrix.gz
Note: actual filenames, -p option are omitted
Note: --binSize is omitted or 1
This is followed by:
Command 2: plotHeatmap
plotHeatmap -m $infile -o $ofile --outFileSortedRegions ${ofile/.$outformat/.bed} --sortUsing mean --outFileNameMatrix ${ofile/.$outformat/.mat} --zMin 0
Where: infile=matrix.gz (output from first command); ofile=matrix.$outformat; outformat typically equals "png"
Output
I have verified that the data are indeed not missing, in at least the first few examples. See the highlighted area of the attached graph (red box).
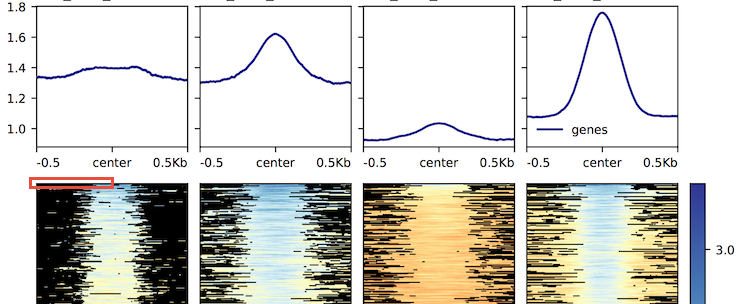
Here is a chunk of the corresponding data stored via the --outFileNameMatrix option:
1.256 1.256 1.256 1.256 1.256 1.256 1.256 1.256 1.256 1.256 1.346 1.346 1.346
I've validated these numbers by looking specifically at this region of the input file (equivalent to file1.bw in Command 1)
#converted to wiggle
track type=wiggle_0
fixedStep chrom=chrII start=2378124 span=1 step=1
1.25641036
1.25641036
1.25641036
1.25641036
1.25641036
1.25641036
1.25641036
1.25641036
1.25641036
1.25641036
1.34615386
1.34615386
1.34615386
Note: this matches the above matrix output when --binSize is set to 1 for Command 1: computeMatrix; the default setting (10) gives the expected results.
This value range should be printed as yellow according to the figure legend (not in screenshot), and represents the middle range of the data being plotted.
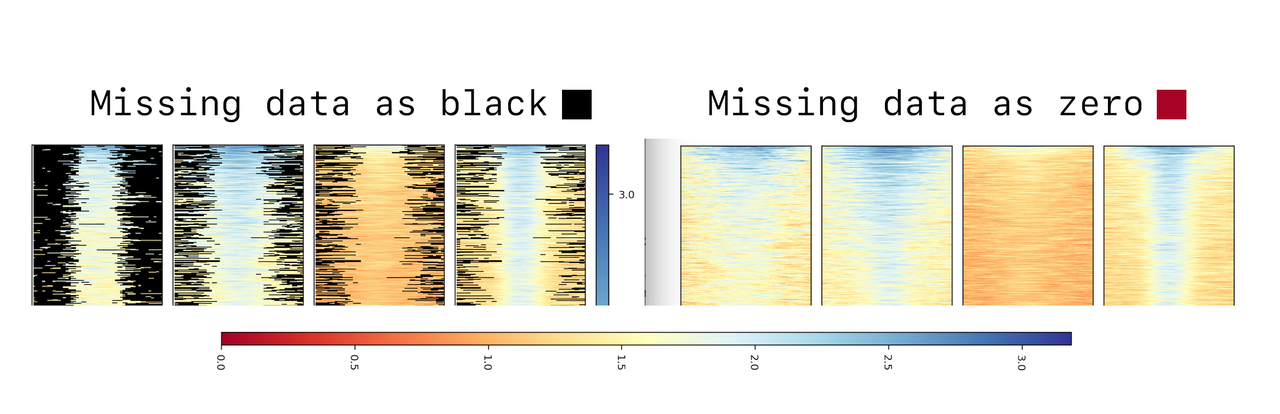
Also, adding the computeMatrix parameter --missingDataAsZero, you would expect all of that black to become red, right?
That is not reflected in this plot:
Question
Does anyone know what might be going on here? Am I running the commands incorrectly (newb)?
Tagging: Devon Ryan
Annoyingly, I don't actually get notified by these :(