Generating a recruitment plot with Blast+ output
Hello,
I was simply wondering how to make a recruitment plot. I have run blastn and have the tabular format output (-outfmt 6) which gives the the information I need such as the genome positions and the percent identity, however, I do not know of programs that may take the information and plot the data such as the plot below:
http://www.frontiersin.org/files/Articles/42855/fmicb-04-00120-HTML/image_m/fmicb-04-00120-g004.jpg
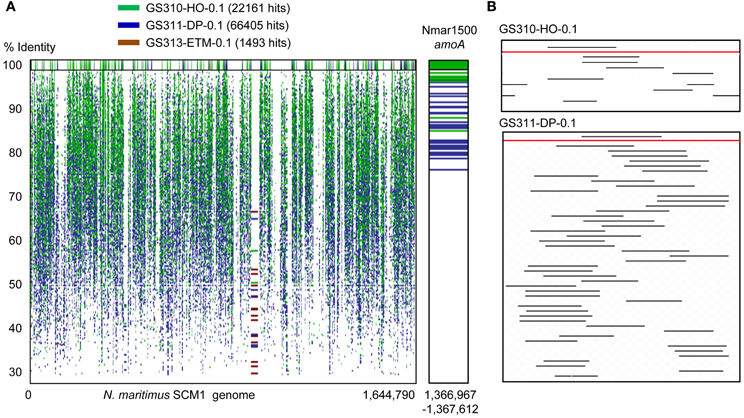
So, does anyone have any recommendations in how to create such a plot? I have tried to use the Enveomics program, but once having installed R and the required packages, it crashes.
Thanks
• 1,418 views
•
link
0 answers
No answers yet.
Log in to answer this question.