Dear all,
I am very new in analyzing data with R. I read almost all the posts here about dot plots and enrichment analysis. I found especially this tutorial very helpful.
It works pretty well with human data or DOSE package. However, I need to analyze sheep data, therefore I tried to use AnnotationForge but it was quite hard for me, so I gave up.
I though I could convert the Ensembl ID from sheep to human using BioMart, but again the problem was that there are several annotations that have more than 1 match. I finally used PANTHER to convert Gene symbols to GO IDs (pretending that my data is human).
So I have a table like this:
GO biological process complete-----------  number--- overUnder----pvalue------  fdr
endothelium development (GO:0003158)......  1.......   +     ..............  3.50E-01....... 5.47E-01
....
I need to convert this into a fancy dot plot like this:
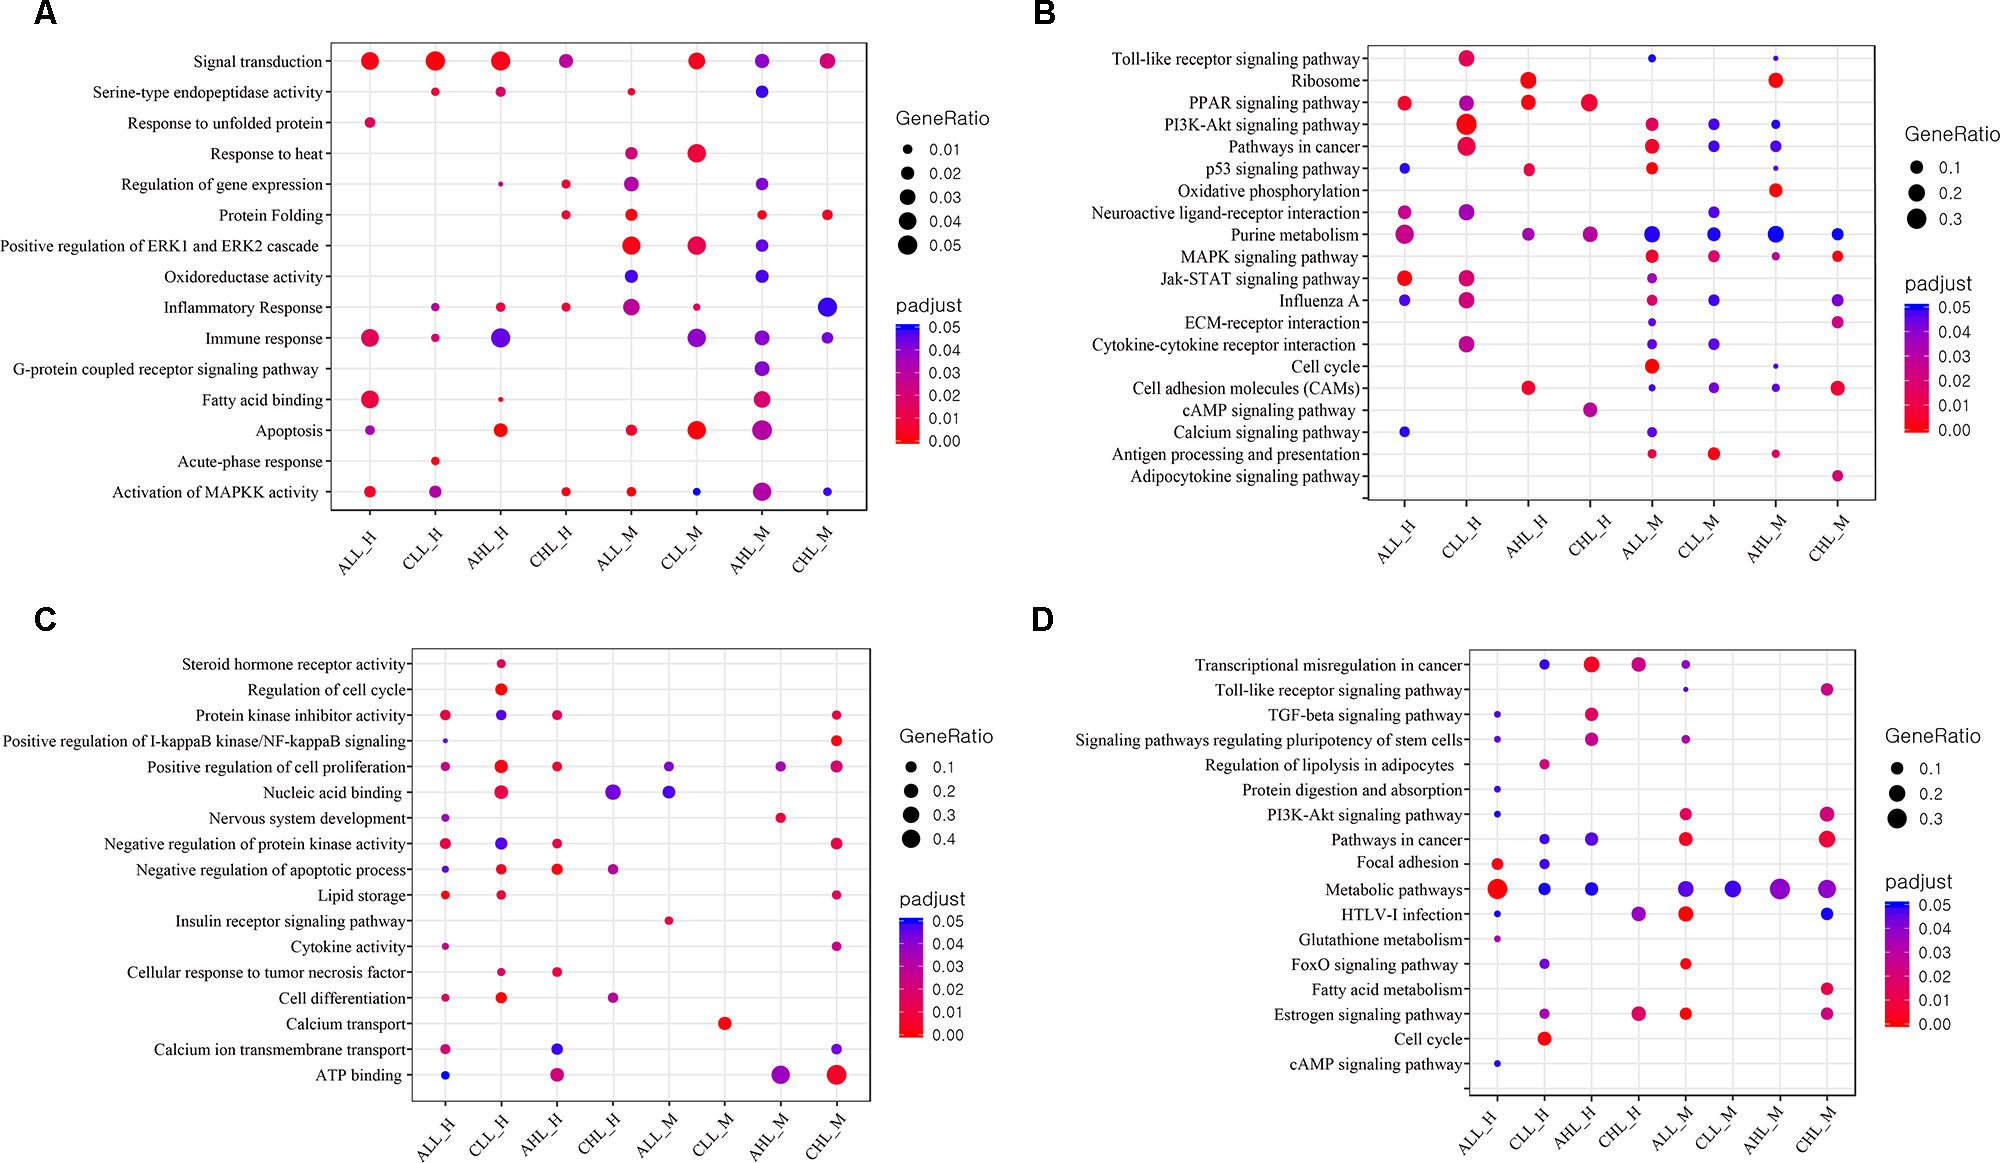
or at least something similar.
Please could somebody tell me a way to make a dot plot with the data I have, or any suggestion with analyzing data from an organism that is not listed.
Thank you very much in advance.
0 answers
No answers yet.
Log in to answer this question.