I have a basic question on the NUMBERS (data) that should be used to plot hypo- and hyper methylation circos plots.
I want to plot a simple circos plot like this paper (DOI=10.3389/fgene.2019.00184):
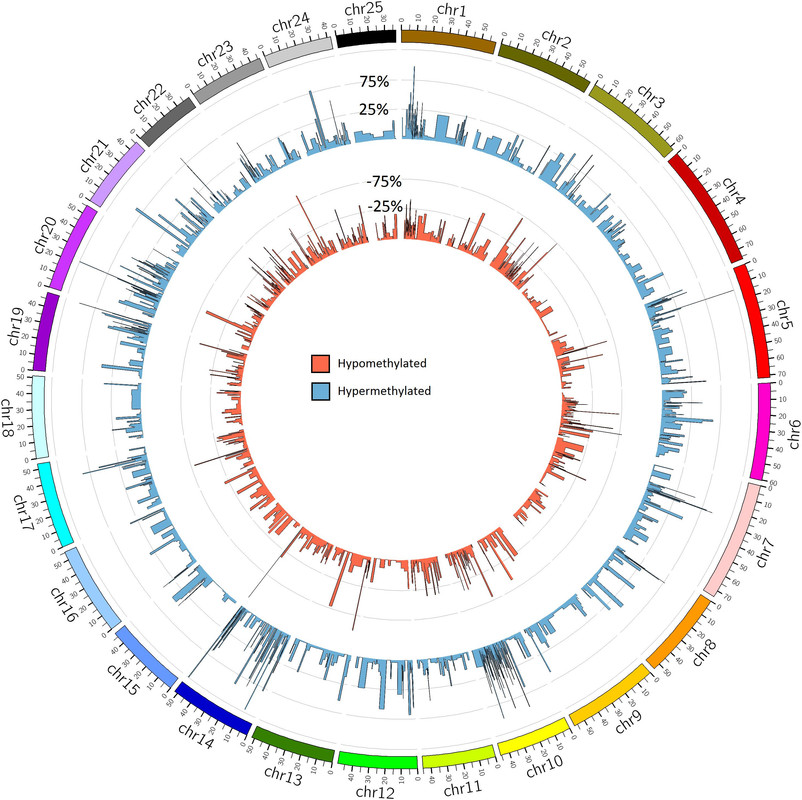
The blue circular bar plot represents percent of hypermethylation and the red circular bar plot shows percent of hypomethylation per region (Q-value <0.01 and **methylation difference >25%**). DM regions in this figure are mean DM per 10 Mbp window.
My data looks like this:

Should I just plot 70.9 as hypo methylation and 45.7 as hyper? is that it?
Also, what would "methylation difference >25%" mean? does it mean 70.9/86.2 should be larger than 25% in order to be included in the circos plot?
0 answers
No answers yet.
Log in to answer this question.