Dot-ploting of two linkage maps in R
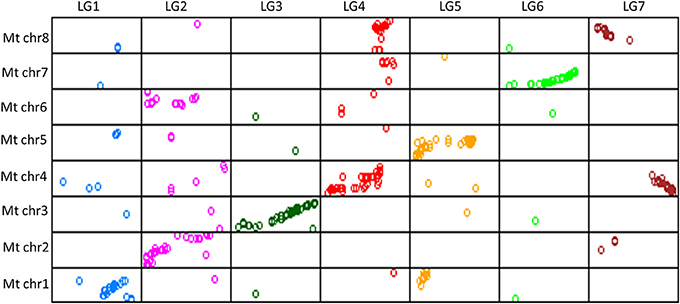
Hi all Recently Im pulling my hair off... Im trying to do graph like this... but I cant find any tutorial how to do it ! I can do simple gg2ploting in R and python but this is beyond me ? How to plot two genetic maps against each other ?! I got 2 .csv files with 3 columns for each genetic map
LG... Genetic Marker ID and position on the map LG1 MB1 0.0 .. LG1 MB54 9.5 etc LG2 MB55 0.0 .. LG2 MB 11.5
Thank you for help ! best Matt
• 2,197 views
•
link
0 answers
No answers yet.
Log in to answer this question.
http://ggplot2.tidyverse.org/reference/geom_dotplot.html
This link is not good?
Hi Natasha Yes and No its very good website for ggplot graphs... but it doesn't solve my problem. Thank you for response ! Matt
Hi Matt, having the first three/four lines of the files would help. Maybe the two maps share the names/positions of the markers? However, I think it is easy. You do a scatter plot in which the X position is the position on your first file, and the Y is the position in the second file. Maybe I am missing something?