I've been playing with AnnotationSketch too. It produces the highest quality images I've seen so far!
• 0 views
•
link
Hi, I need to draw a DNA region (not a plasmid) including a gene and different annotations, which software could be used for this. If it is freeware should be great, but any answer is appreciated.
If you are a Perl fan, Bio::Graphics. It was a part of BioPerl distribution, earlier, but later moved as a separate project. Once you are done with the installation, the HOWTO:Graphics tutorial can get you started. You may download it as a separate package from CPAN. Jan Aerts' implemented a BioRuby version for Ruby. You can download Bio::Graphics for Ruby, tutorials and docs here.
Bio::Graphics Perl Example from HOW-TO:

Bio::Graphics Ruby Example from Rubyforge:

Well, I can think of a couple of things I would use. But they are much simpler than the other answers and may not meet the need at all.
In our Current Protocols UCSC Browser paper we have a simple example you could copy to get started. Or just use the sample over at UCSC. EDIT: oops, forgot the paper link http://www.ncbi.nlm.nih.gov/pubmed/19816931
(By the way, in the editing interface my numbers are 1 and 2, not 1 and 1. I can count: http://screencast.com/t/ZWMzOTBhOWIt. Where do I report bugs?)
I am underthinking this I'm sure :), but if this was a region of a completed genome, couldn't one just create a custom track on the UCSC genome browser (http://genome.ucsc.edu) from user-generated data or a table browser search and view it in the genome browser? (http://genome.ucsc.edu/goldenPath/help/customTrack.html). Save the pic using the pdf/ps link at the top of the browser
Or if the region and annotations are already in the database, just view the region with the UCSC Genome Browser, configure the annotations as you wish, and save the pic?
Admittedly, this doesn't have unlimited flexibility, but it would be a quick and dirty way to get a gene region and annotations as a graphic.
Of course this would work with Ensembl or a GBrowse-based browser
2 years ago I wrote a XSL stylesheet transforming the XML output of blast to SVG.
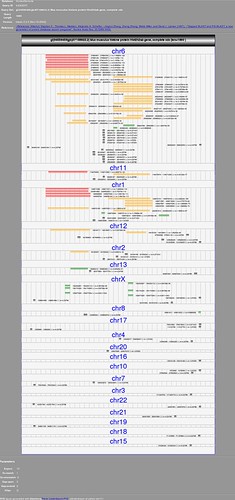
or using the mysql data from the UCSC with a PHP script.

once your image is correctly scaled in SVG, you can dot whatever you want with it using, e.g., Inkscape
I have used the GenomeTools Annotation Sketch utility quite frequently recently. It has both a web-based version and a command-line version that you can download and run locally, both available at the link. You just have to provide it with a valid GFF file.
Alternatively, you could try something like Apollo or Artemis, but I've had problems with those recently.
I've been playing with AnnotationSketch too. It produces the highest quality images I've seen so far!
For something simple with a GUI, you could try [?]ApE[?] (assuming you don't want to get into coding anything).
Most plasmid drawing programs will draw a linear sequence, as long as you specify that the source DNA is linear. So you might want to check if your institution has a site license for Vector NTI or Lasergene, either of which will do basic annotation of sequences (ORFs, start/stops, exons, etc.). If you want to do plots as well you may have to roll your own.
Log in to answer this question.