Thank a lot! That indeed helped me a lot.
• 0 views
•
link
Hi all,
I have a family of genes (over 400 seperate genes) and I want to visualize their position on genome/chromosomes. That means, to get a map of chromosomes indicating the position of each of these genes. Is there any software/online tool to do so?
Thank you very much, Panos
If you can convert your data into GFF3-formatted elements, GenomeTools offers gt sketch that might help you out. Render into PDF and you can do markup with Adobe Illustrator or Inkscape.
You can also look into preparing a custom track on the UCSC Genome Browser.
Once you have added your custom track, you can use the Genome Graphs functionality to visualize it on chromosome ideographs (you can also visualize other signals with the same tool) and the View > PDF menu option to export a PDF file.

Thank a lot! That indeed helped me a lot.
If you can use R you can use karyoploteR for this.
If your genes are in a bed file you can plot them with
library(karyoploteR)
library(regioneR)

genes <- toGRanges("genes.file.bed")

kp <- plotKaryotype(genome="hg19")
kpPlotRegions(kp, data=genes)
and you will get something like this
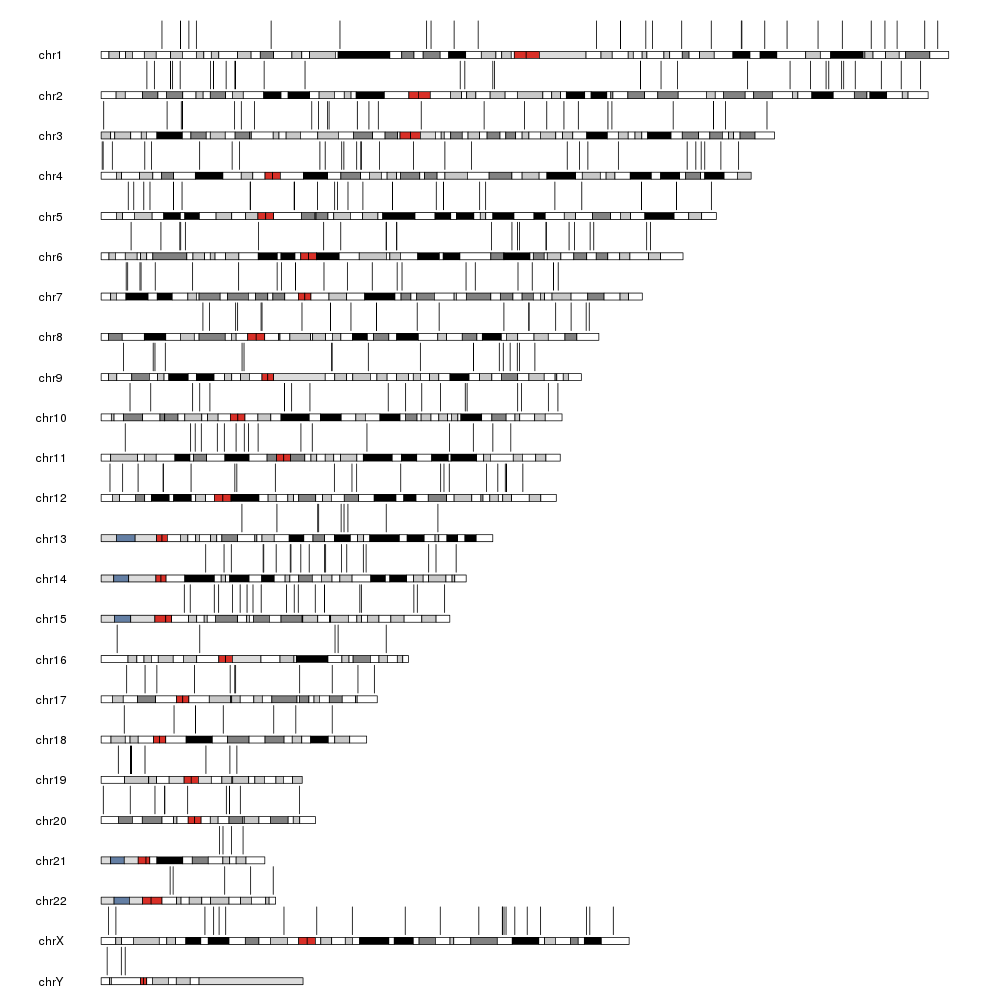
You can add additional data, the gene names for example, or customize the appearance however you want. You can find more details at the karyoploteR tutorial page.
Nice example — will put this in the bank!
Log in to answer this question.
duplicate of :