How Do I Draw A Heatmap In R With Both A Color Key And Multiple Color Side Bars?
5
74
Entering edit mode
12.1 years ago

I often use heatmap.2 {gplots} because of its many improvements/options over the standard heatmap function. However, occasionally I require multiple color side bars (heatmap.2 only supports one on each axis). It is possible to do this with heatmap.plus. However, you then lose other features like the value color key, breaks, level trace, etc. Furthermore, beyond ~3 columns/rows of color sidebars, the bars are too squeezed together to see clearly, or to be able to read the labels. Any solutions out there?

heatmap r • 180k views
ADD COMMENT
1
Entering edit mode

Thanks! That's really useful. BTW, could you provide a complete example to exactly reproduce your figure?

ADD REPLY
0
Entering edit mode

This should have been a comment. Not an answer. I have provided example R code. Unfortunately I am not able to provide a complete example because the data underlying this particular figure is very large and not available for public posting yet.

ADD REPLY
0
Entering edit mode

I found some time and re-worked my answer above to provide a complete working example, now on random data, rather than data I couldn't release here.

ADD REPLY
1
Entering edit mode

cited in : "SEER and Gene Expression Data Analysis Deciphers Racial Disparity Patterns in Prostate Cancer Mortality and the Public Health Implication" https://www.nature.com/articles/s41598-020-63764-4

ADD REPLY
0
Entering edit mode

Hi,

I have a question about the script above. When I run it I get the error message:

Error in heatmap.3(prob_matrix, hclustfun = myclust, distfun = mydist,:
object 'Â' not found.

I read a lot but I cannot find any solution. Has anybody an idea?

Thanks in advance.

Janita

ADD REPLY
0
Entering edit mode

This should have been a comment to the answer given above. You seem to have an encoding problem, does it really say 'Â'?

ADD REPLY
0
Entering edit mode

yes it does. Do you have an idea how to fix this?

ADD REPLY
0
Entering edit mode

I have the same issue. Great post.

ADD REPLY
0
Entering edit mode

I can't guess what this might be. Other than making sure that I had gplots and devtools installed, I just copied and pasted the script below into R verbatim and it ran without error. At what point exactly does this error occur? The only thing I can guess is that it is some browser issue?

ADD REPLY
0
Entering edit mode

I run into the same problem too. I'm using Rstudio 0.98 and R 3.1.2.

I ran only the following code.

drug_names=paste("drug",letters[1:20],sep="_")
patient_ids=paste("patient",c(1:100),sep="_")
rownames(prob_matrix)=drug_names
colnames(prob_matrix)=patient_ids

heatmap.3(prob_matrix)

and got the error message

Error in heatmap.3(prob_matrix) : object 'Â' not found

I searched a lot but can't find anything of 'Â' means. Has anyone solve this?

Thanks,
Jack

ADD REPLY
0
Entering edit mode

I still can't really guess what is going on here. I just copied the code below into Rstudio 0.98 (R 3.1.2) and it ran without problems. If you type 'heatmap.3' I presume you see the function code has been successfully loaded into your session using source_url? Similarly, typing 'prob_matrix' produces sensible output? I'm guessing you have gplots and devtools installed and loaded or you would have gotten a different error. The only thing I can imagine is that your browser is doing something weird when you copy/paste the code from biostar and some hidden characters are coming along for the ride. Maybe try going directly to the source at github for both the function code and example script. See https://github.com/obigriffith/biostar-tutorials. You want Heatmaps/heatmap.3.R and Heatmaps/heatmap3_example.R. Safest might be to just clone the whole repo, navigate to the correct folder and then copy the function and script into R/Rstudio from a text editor you trust.

ADD REPLY
0
Entering edit mode

By copying the whole heatmap.3.R code fixed this problem. I think its because there is something wrong with the following code. But I'm not sure.

source_url("https://raw.githubusercontent.com/obigriffith/biostar-tutorials/master/Heatmaps/heatmap.3.R")

Thanks a lot for your help!

ADD REPLY
84
Entering edit mode
12.1 years ago

I answered my own question by finding this http://tolstoy.newcastle.edu.au/R/e9/help/10/02/6212.html post in the R-help mailing list. If you replace the corresponding blocks in heatmap.2 with blocks of code provided in that post you can get multiple color side bars in heatmap.2. See http://tolstoy.newcastle.edu.au/R/e9/help/10/02/6307.htm for more customizations.

UPDATE2: https://github.com/nachocab made further improvements that allows a 1-dimensional matrix for the annotations, and fixed the NA problem in the color key. @amcdavid contributed a further fix to the former.

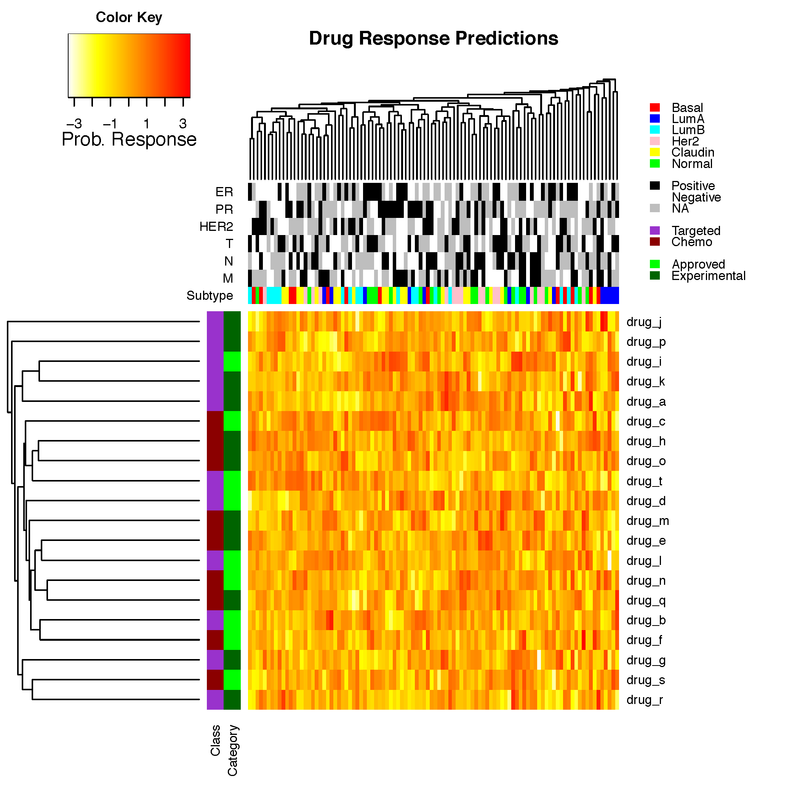
UPDATE3: I have tidied this post up a bit. Added back image which got lost along the way. Here is the latest code (github). You can just source this file and then call the heatmap.3 function with the new options as in the below example.

#If not already installed
#install.packages("gplots")
#install.packages("devtools")

#Load necessary packages
library("gplots")
library("devtools")

#Load latest version of heatmap.3 function
source_url("https://raw.githubusercontent.com/obigriffith/biostar-tutorials/master/Heatmaps/heatmap.3.R")

#Set a working directory for output files
setwd("/Users/ogriffit/git/biostar-tutorials/Heatmaps")

#Create a fake dataset for demonstration purposes
prob_matrix=replicate(100, rnorm(20))
drug_names=paste("drug",letters[1:20],sep="_")
patient_ids=paste("patient",c(1:100),sep="_")
rownames(prob_matrix)=drug_names
colnames(prob_matrix)=patient_ids

#Create fake color side bars
drugclass_colors=sample(c("darkorchid","darkred"), length(drug_names), replace = TRUE, prob = NULL)
drugcategory_colors=sample(c("green","darkgreen"), length(drug_names), replace = TRUE, prob = NULL)
subtype_colors=sample(c("red","blue","cyan","pink","yellow","green"), length(patient_ids), replace = TRUE, prob = NULL)
Mcolors=sample(c("black","white","grey"), length(patient_ids), replace = TRUE, prob = NULL)
Ncolors=sample(c("black","white","grey"), length(patient_ids), replace = TRUE, prob = NULL)
Tcolors=sample(c("black","white","grey"), length(patient_ids), replace = TRUE, prob = NULL)
HER2colors=sample(c("black","white","grey"), length(patient_ids), replace = TRUE, prob = NULL)
PRcolors=sample(c("black","white","grey"), length(patient_ids), replace = TRUE, prob = NULL)
ERcolors=sample(c("black","white","grey"), length(patient_ids), replace = TRUE, prob = NULL)
rlab=t(cbind(drugclass_colors,drugcategory_colors))
clab=cbind(subtype_colors,Mcolors,Ncolors,Tcolors,HER2colors,PRcolors,ERcolors)
rownames(rlab)=c("Class","Category")
colnames(clab)=c("Subtype","M","N","T","HER2","PR","ER")

#Define custom dist and hclust functions for use with heatmaps
mydist=function(c) {dist(c,method="euclidian")}
myclust=function(c) {hclust(c,method="average")}

#Create heatmap using custom heatmap.3 source code loaded above
pdf(file="heatmap3_example.pdf")
main_title="Drug Response Predictions"
par(cex.main=1)
heatmap.3(prob_matrix, hclustfun=myclust, distfun=mydist, na.rm = TRUE, scale="none", dendrogram="both", margins=c(6,12),
Rowv=TRUE, Colv=TRUE, ColSideColors=clab, RowSideColors=rlab, symbreaks=FALSE, key=TRUE, symkey=FALSE,
density.info="none", trace="none", main=main_title, labCol=FALSE, labRow=drug_names, cexRow=1, col=rev(heat.colors(75)),
ColSideColorsSize=7, RowSideColorsSize=2, KeyValueName="Prob. Response")
legend("topright",legend=c("Basal","LumA","LumB","Her2","Claudin","Normal","","Positive","Negative","NA","","Targeted","Chemo","","Approved","Experimental"),
fill=c("red","blue","cyan","pink","yellow","green","white","black","white","grey","white","darkorchid","darkred","white","green","darkgreen"), border=FALSE, bty="n", y.intersp = 0.7, cex=0.7)
dev.off()

#Example to show that it now also works with just a single column or single row
mat <- matrix(1:100, byrow=T, nrow=10)
column_annotation <- sample(c("red", "blue", "green"), 10, replace=T)
column_annotation <- as.matrix(column_annotation)
colnames(column_annotation) <- c("Variable X")

row_annotation <- sample(c("red", "blue", "green"), 10, replace=T)
row_annotation <- as.matrix(t(row_annotation))
rownames(row_annotation) <- c("Variable Y")

heatmap.3(mat, RowSideColors=row_annotation, ColSideColors=column_annotation)

ADD COMMENT
3
Entering edit mode

Cool, thanks!

FYI: I'm pretty sure you want to change the default values for the symbreaks and symkey args from min(x < 0, na.rm=TRUE) to min(x, na.rm=TRUE) < 0, no?

ADD REPLY
0
Entering edit mode

Yes. I think you are correct. I just copied that default from heatmap.2 code. I can't say that I've noticed a problem with this. I usually have only positive values and don't scale. But, it looks like the default behavior is not working as stated in the documentation (i.e., symbreaks/symkey "Defaults to TRUE if the data includes negative values, and to FALSE otherwise"). Currently it defaults to TRUE if ALL values are negative or if scale!="none" is TRUE. Could also be fixed by changing to max(x < 0, na.rm=TRUE). Fixed in my uploaded file.

ADD REPLY
0
Entering edit mode

The HTML seems mangled now. The heatmap.3 code can be found here

ADD REPLY
0
Entering edit mode

Hi Obi, I just found heatmap.3 in package GMD. Is this (http://www.inside-r.org/packages/cran/GMD/docs/heatmap.3) related code or based on yours, or is it indeed heatmap.3b?

ADD REPLY
0
Entering edit mode

Hi Michael,

Unfortunately they are unrelated. So, this is indeed heatmap.3b or more accurately maybe heatmap.2.1. Since I and others just made minor changes to heatmap.2. Not sure what all was done in the GMD package. Really the minor improvements developed here should really just be submitted as fixes/improvements to the official heatmap.2 package in gplots. But, I admit that I have neither the expertise nor time to actually do so. :-(

Obi

ADD REPLY
0
Entering edit mode

When I ran the heatmap.3 function to try to get a heatmap with multiple sidebars with the exactly the same scripts and dataset that Obi provided, it failed and showed the error message. The script and error message are showed below.

heatmap.3(prob_matrix, 
          hclustfun = myclust,
          distfun = mydist,
          na.rm = TRUE,
          scale = "none",
          dendrogram = "both",
          margins = c(4,10),
          Rowv = TRUE,
          Colv = TRUE,
          ColSideColors = clab,
          RowSideColors = rlab,
          symbreaks = FALSE,
          key = TRUE,
          symkey = FALSE,
          density.info = "none",
          trace = "none",
          main = main_title,
          labCol = FALSE,
          labRow = drug_names,
          cexRow = 1,
          col = rev(heat.colors(75)),
          NumColSideColors = 7,
          KeyValueName = "Prob. Response")

Error in heatmap.3(prob_matrix, hclustfun = myclust, distfun = mydist,:
    'RowSideColors' must be a matrix of ncol(x) columns

Is there anyone who had the same problem as shown above? Something is wrong with the RowSideColors argument.

Thanks.

ADD REPLY
0
Entering edit mode

Hm, works for me. I tried both codes from github. Note that you only need heatmap.3 if you require more than one row/column in ColSideColors/RowSideColors.

ADD REPLY
0
Entering edit mode

I do need multiple sidebars at the column side. I tried both codes from github, too. None of them works unfortunately. Is there any bug or compatibility problem between the heatmap.3 code and latest version of R (my one is R X64 3.0.1)? Thanks.

Jeff

ADD REPLY
0
Entering edit mode

right, but you didn't use the example data provided with the code. The error is possibly literally what R tells you: 'RowSideColors' must be a matrix of ncol(x) columns, and I guess that is not the case. You need the column annotations as a matrix with the same number of columns as the data matrix. So what does rlab look like?

ADD REPLY
0
Entering edit mode

I did exactly use the same example data provided with the code for testing. After executing rlab command, you can see the following matrix.

> rlab

class

[1,] "darkorchid" "darkorchid" 
[2,] "darkred"    "darkred" 
[3,] "darkorchid" "darkorchid" 
[4,] "darkred"    "darkred" 
[5,] "darkorchid" "darkorchid" 
[6,] "darkred"    "darkred" 
[7,] "darkred"    "darkred" 
[8,] "darkorchid" "darkorchid" 
[9,] "darkorchid" "darkorchid" 
[10,] "darkred"    "darkred" 
[11,] "darkred"    "darkred" 
[12,] "darkred"    "darkred" 
[13,] "darkorchid" "darkorchid" 
[14,] "darkred"    "darkred" 
[15,] "darkorchid" "darkorchid" 
[16,] "darkred"    "darkred" 
[17,] "darkorchid" "darkorchid" 
[18,] "darkorchid" "darkorchid" 
[19,] "darkorchid" "darkorchid" 
[20,] "darkred"    "darkred"

It is a 2-column-and-20-row matrix.

As you stated above, the column annotations should be a matrix with the same number of columns as the data matrix. The example matrix has 100 columns, do I have to make the column annotation (rlab) as a matrix with 100 columns? If this is the case, do you think the sidebar generated will be too wide?

ADD REPLY
0
Entering edit mode

sorry I meant clab for ColSideColors. I think you have to make a 100 column, two row matrix to test, try clab = matrix(c("red","green","blue"), ncol=100, nrow=2). ofc you should have some sensible annotation data for your columns somewhere.

ADD REPLY
0
Entering edit mode

Hi, In the above heatmap given by Obi griffith how to get all "Basal" subtype as one cluster? I mean all samples showing red should be clustered. In the same way other subtypes also. I see that sample() function which is used for creating fake colors randomly reorders the elements. But I don't want to do that. So how can I assign fake color side bars? Any idea please?

ADD REPLY
0
Entering edit mode

When I am trying heatmap.3 I am getting error

object 'Â' not found
ADD REPLY
0
Entering edit mode

you can copy heatmap.3 script using this link "https://github.com/obigriffith/biostar-tutorials/blob/master/Heatmaps/heatmap.3.R" and save like a new script in your computer (named : "heatmap.3"(*. R file). Now you can load "heatmap.3" function using "source R code"

ADD REPLY
0
Entering edit mode

How do I turn off the clustering feature? I don't want to cluster my data just only plot!!

ADD REPLY
0
Entering edit mode

You can set dendrogram="none" to stop drawing the dendrograms. To stop actual clustering you can set Rowv=FALSE and/or Colv=FALSE depending on which dimension(s) you don't want clustering for. If you turn off both, you could also drop the hclustfun and distfun parameters since these will have no use without any clustering.

ADD REPLY
0
Entering edit mode

Hi, In the above heatmap how to get all "Basal" subtype as one cluster? I mean all samples showing red should be clustered. In the same way other subtypes also. I see that sample() function which is used for creating fake colors randomly reorders the elements. But I don't want to do that. So how can I assign fake color side bars? Any idea please?

ADD REPLY
7
Entering edit mode
10.9 years ago

Revisiting this old(er) q/a tutorial as I just came across the aheatmap function in the NMF package, which has slipped under my radar up until now and thought it might be useful to others since it does similar mojo.

The authors also have a nice vignette which is linked from their main page that shows off some of what it can do.

One added extra bonus is that it lets you plot multiple heatmaps in one plot as it is compatible with, for example, the par(mfrow=c(1,2)) mojo.

ADD COMMENT
1
Entering edit mode

very cool package!

ADD REPLY
7
Entering edit mode
10.9 years ago
David ▴ 740

There is a package for that called Heatplus http://www.bioconductor.org/packages/release/bioc/html/Heatplus.html

enter image description here

ADD COMMENT
0
Entering edit mode

Thanks for posting about this. I was aware of heatmap, heatmap.2 and heatmap.plus. The latter does add the ability for multiple color side bars but then you lose other nice features of heatmap.2 (e.g., the color key). Thus the original reason for my post. It looks like heatplus might solve this. Although, in the vignette I don't see an example that has both row and column color sidebars AND a color key.

ADD REPLY
6
Entering edit mode
11.5 years ago
Nachocab ▴ 100

Here's a revision on @Obi Griffiths code that allows using a 1-dimensional data.frame for the annotations, and fixes the NA problem in the color key:

Here's how you would call it:

mat <- matrix(1:100, byrow=T, nrow=10)
column_annotation <- sample(c("red", "blue", "green"), 10, replace=T)
column_annotation <- as.matrix(column_annotation)    
colnames(column_annotation) <- c("True")
heatmap.3(mat, ColSideColors=column_annotation)
ADD COMMENT
2
Entering edit mode

2016 update: These days I recommend the excellent aheatmap function from the NMF package.

ADD REPLY
0
Entering edit mode

Can you provide a code snippet? No matter how I try creating a 1-dimensional data.frame I get an error when trying to run your modified code. I assumed that something like rlab=data.frame(Class=drug_colors) would work. But that returns:

Error in heatmap.3(prob_matrix, hclustfun = myclust, distfun = mydist, : 'RowSideColors' must be a character vector of length nrow(x).

If I try providing a character vector I get

Error in if (!is.character(RowSideColors) || dim(RowSideColors)[1] != : missing value where TRUE/FALSE needed

I also tried converting the 1-dimensional data.frame column to a character strings with (as.character) and also tried inputting a 1-dimensional matrix. But nothing worked. I must be missing something...

ADD REPLY
0
Entering edit mode

Nachocab. Still wondering if you can demonstrate how your code works with 1-dimensional data.

ADD REPLY
0
Entering edit mode

Hi Obi, I'm sorry I missed your message. I just added a snippet to my answer (I think you might have been missing the as.matrix() step). Send me an email next time

ADD REPLY
0
Entering edit mode

Hi Nachocab. Thanks for getting back to me. I did try as.matrix. It looks like it works for ColSideColors with a single column matrix of colors but not for RowSideColors with a single column (or single row) matrix of colors. Did you by chance update the code for one but not the other?

ADD REPLY

Login before adding your answer.

Traffic: 1681 users visited in the last hour
Help About
FAQ
Access RSS
API
Stats

Use of this site constitutes acceptance of our User Agreement and Privacy Policy.

Powered by the version 2.3.6