R: bisulfite squencing PCR plot
Hi All,
Do you have R code for the bisulfite sequencing PCR result plotting script.
Thanks

• 3,163 views
•
link
3 answers
There might be a package that will produce those exactly, but if not you can do it in ggplot2:
d <- data.frame(CpG=rep(1:10,4), read=rep(1:4, each=10), value=sample(c(1,16), 40, replace=T))
ggplot() + scale_shape_identity() + geom_point(data=d, aes(x=CpG, y=read, shape=value), size=5)
Note that you'll need to tweak the size, remove the background, etc., but that should serve as a start.
• 0 views
•
link
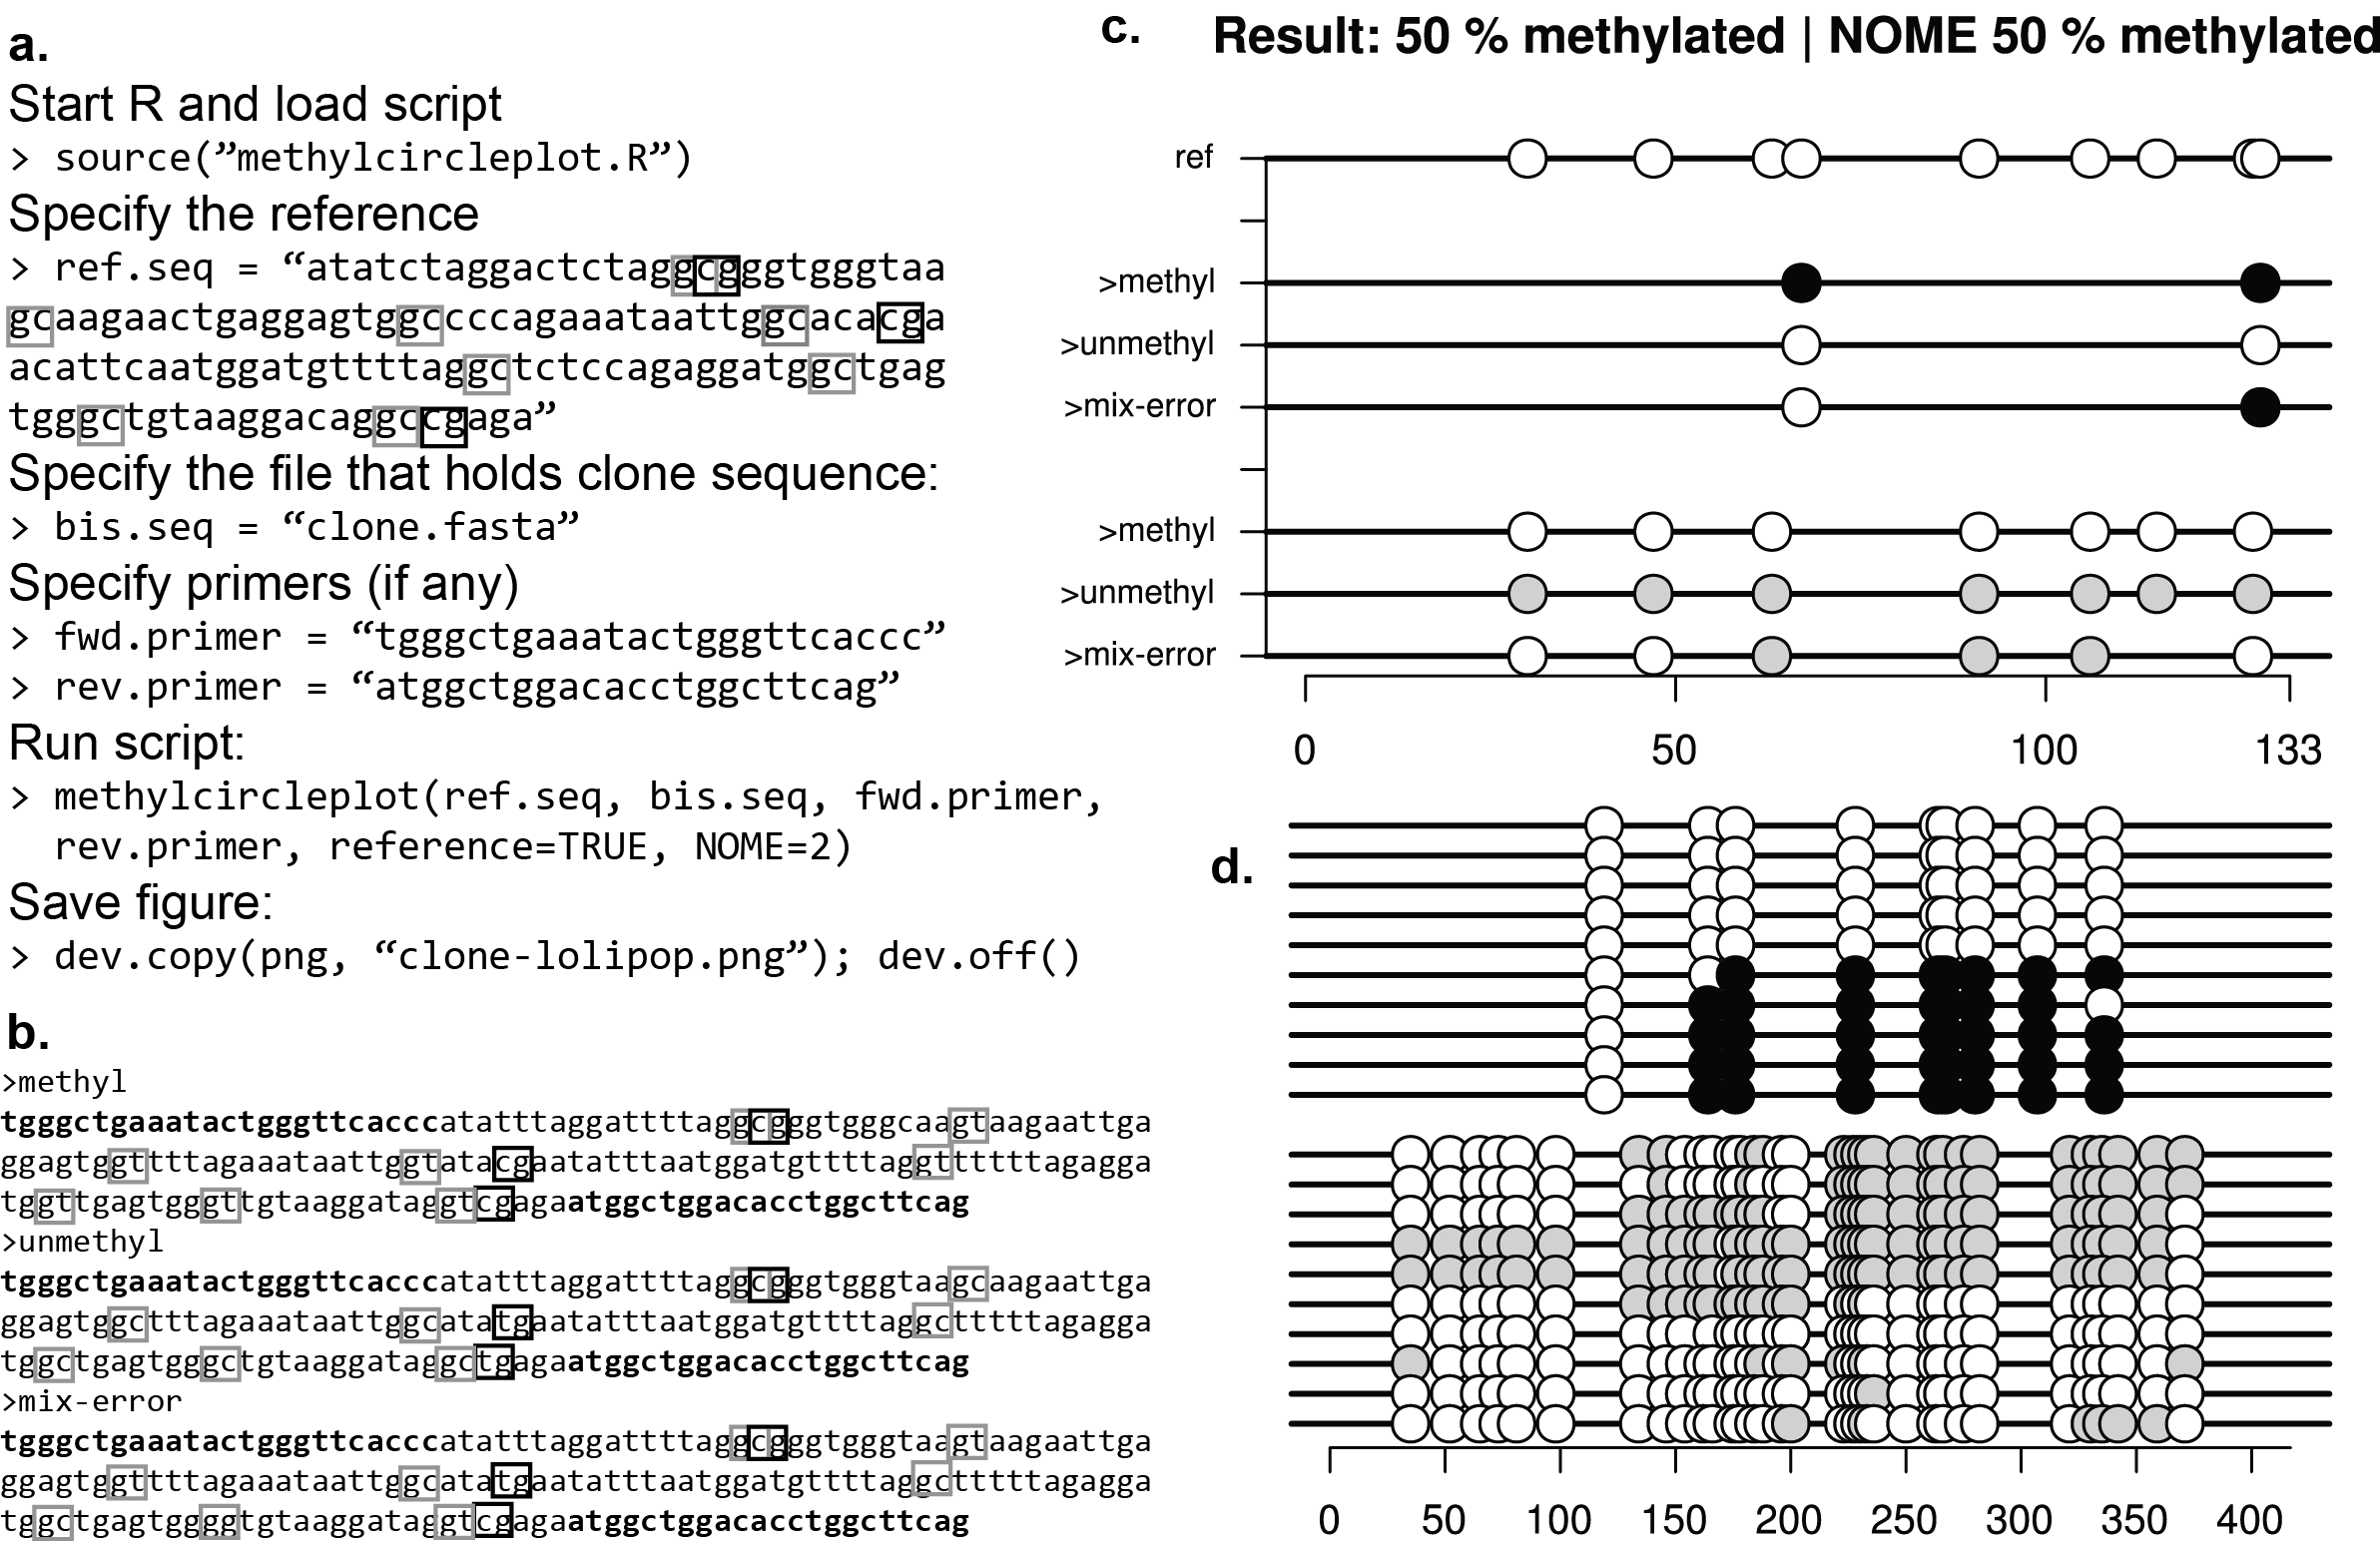
I made a plotter that will start with PCR data and will also do nucleosome footprinting (NOMe-seq)
https://github.com/ying-w/bioinformatics-figures/tree/master/methylcircleplot
• 0 views
•
link
Thanks. Devon, It would be more perfect with the suitable setting: coord_cartesian
library("ggplot2")
d <- data.frame(CpG=rep(1:10,4), read=rep(1:4, each=10), value=sample(c(1,16), 40, replace=T))
ggplot() + scale_shape_identity() + geom_point(data=d, aes(x=CpG, y=read, shape=value), size=9)+coord_cartesian(ylim = c(0, 5))
• 0 views
•
link
Log in to answer this question.