
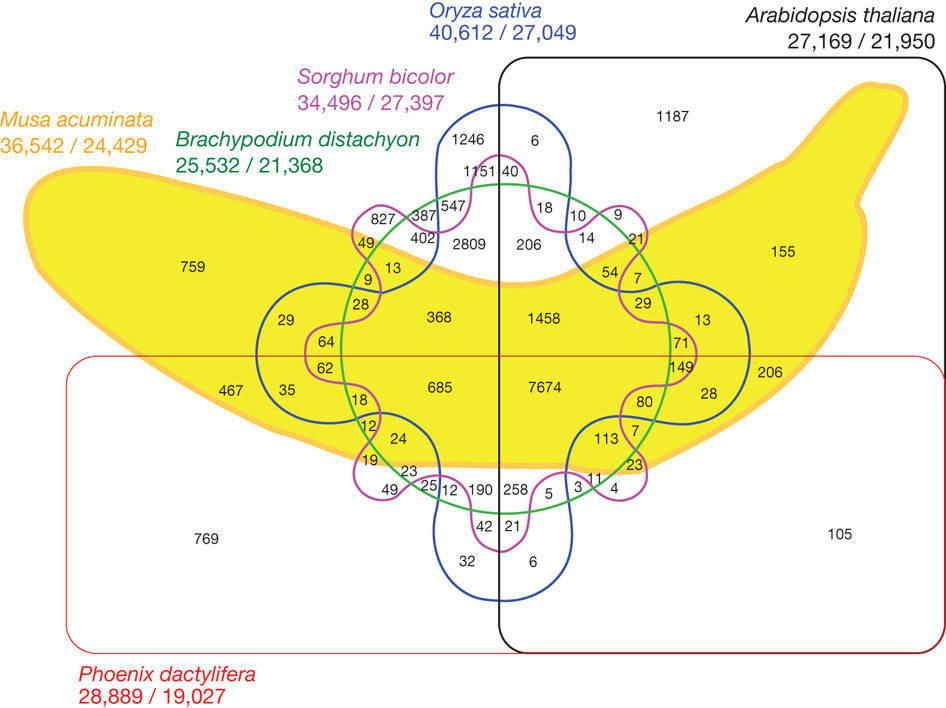
Good call. These banana venn diagrams can make people crazy, and that's with just 6 sets.
• 0 views
•
link
How can I make a diagram like this image using Python or R for 10 sets? Which tools should I use?
For 10 sets you can use UpSet plot. You can generate it for example with UpSetR or ComplexHeatmap package.
Good call. These banana venn diagrams can make people crazy, and that's with just 6 sets.
That is a Venn diagram. You can use ggplot library in R to create Venn diagrams. You can also use matplotlib_venn and matplotlib in Python. hope my comment will be helpful
via google image: https://www.datanovia.com/en/blog/venn-diagram-with-r-or-rstudio-a-million-ways/
This article provides multiple solutions to create an elegant Venn diagram with R or RStudio. The following R packages will be illustrated: ggvenn, ggVenDiagram, VennDiagram and the gplots packages.
Log in to answer this question.
Have you tried Googling anything before asking here?