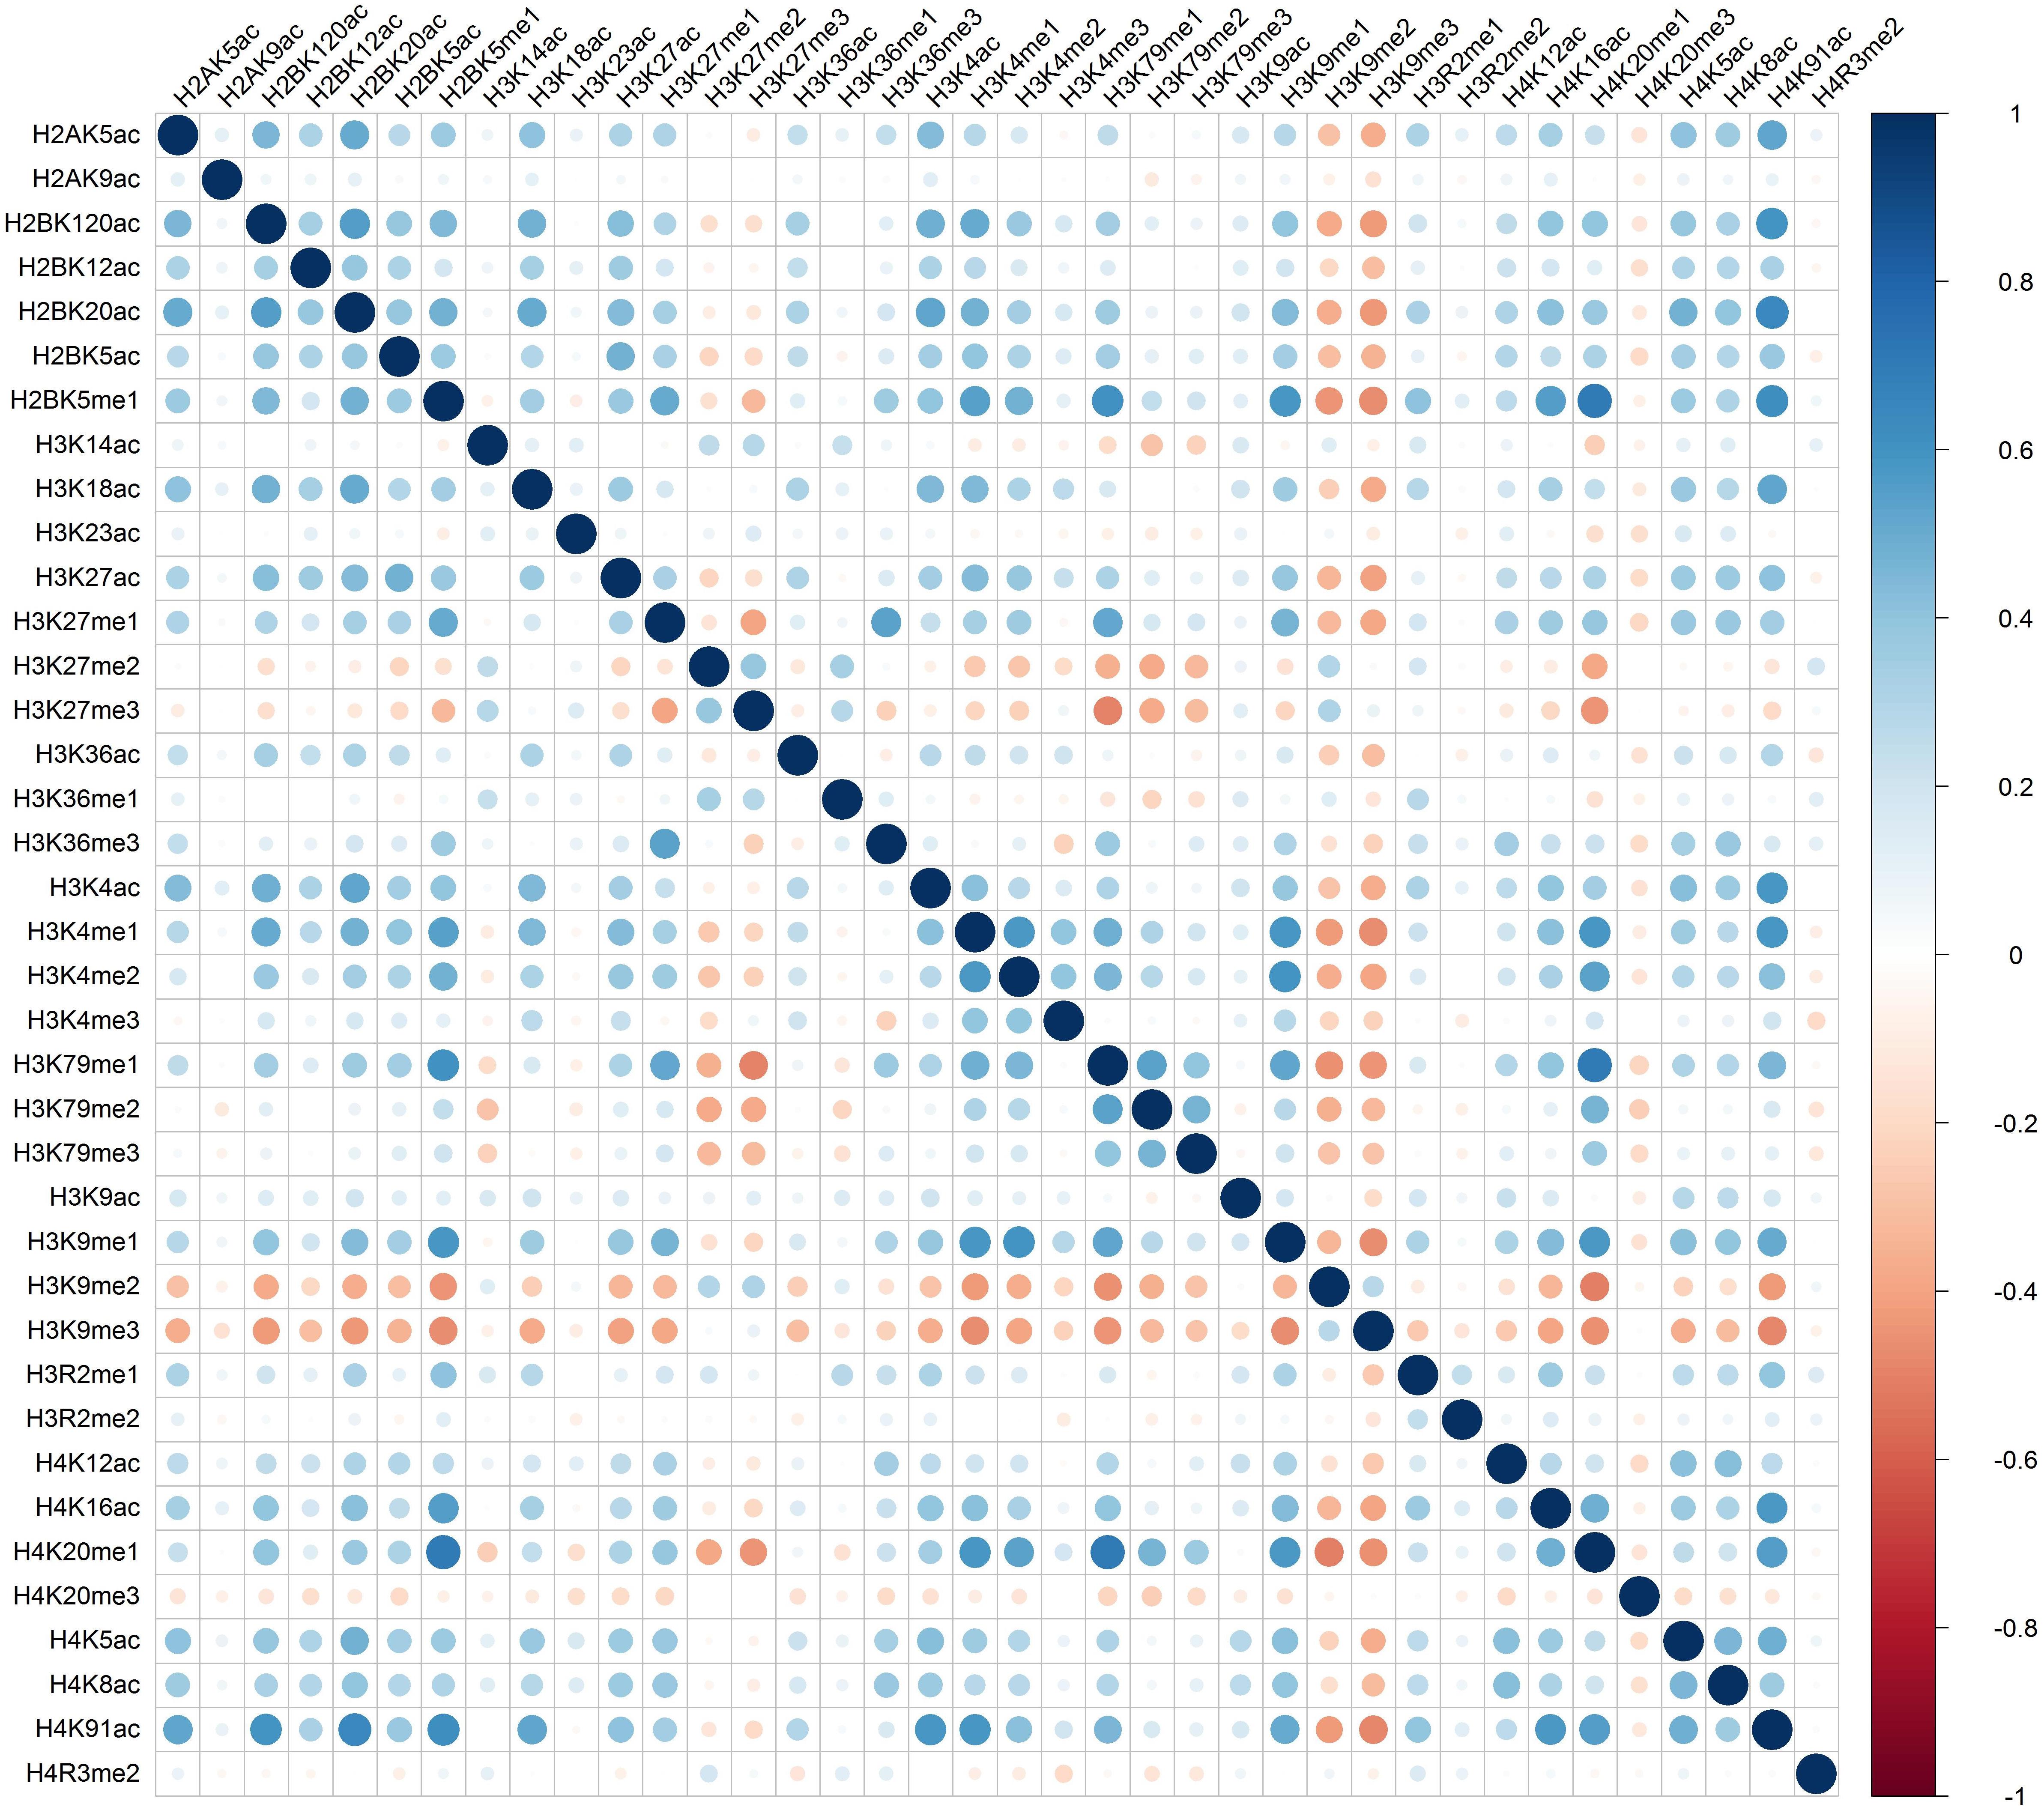
Pearson correlation coefficients of histone modifications at specific region
Hi,
i have 7 different histon modifications chip-seq data, i want to see these histon modifications' correlation at a specific region(like promoter or enhancer), i want draw a heatmap, so what should i do?
this is a sample: https://www.frontiersin.org/files/Articles/444142/fgene-10-00122-HTML/image_m/fgene-10-00122-g001.jpg
• 961 views
•
link
1 answer
Not exactly what you want, but deepTools has a whole bunch of functionality that still gets at that question. Especially the plotHeatmap function
• 0 views
•
link
Log in to answer this question.
If you could give a proper reference to the source of that figure, we could look up the methods. Have you looked at the methods section? What sort of tools would you like to use? Are you familiar with R? It has some nice libraries which makes examining these kinds of correlations fairly easy.