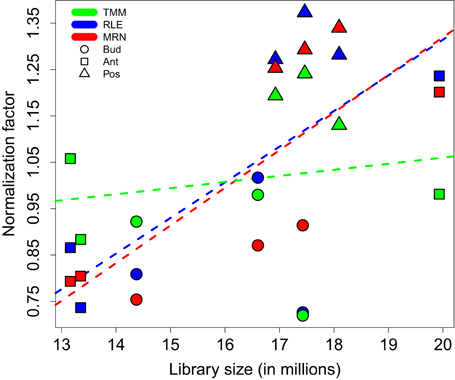
Normalization factors for the fruit set RNA-Seq data depending on corresponding library sizes. All three studied normalization methods are carried out with default settings. For all three methods, regression (dashed) lines are estimated from a simple linear regression modeling the relationship between default normalization factors and library sizes. Color key: TMM, RLE, and MRN are respectively colored in green, blue, and red. Key to symbols: Bud, Ant, and Pos stages are respectively drawn with circles, squares, and triangles.
Question: What is the relationship between library size and normalization factor? What does it mean if the regression line have R^2 of 0.9?
Q: What is the relationship between library size and normalization factor?
The answer is right there if you read a bit further:
"Indeed, it is known that TMM normalization factors do not take into
account library sizes. This fact is illustrated in Figure 1 by an
almost horizontal regression line. On the contrary, RLE and MRN
factors are closer to each other, and share a positive correlation
with the library size."
Q: What does it mean if the regression line have R^2 of 0.9?
A regression (linear regression here) R2 tells how good the curve (here line) fits is to your data. If all the data are on line, R2 = 100. You can also think this in term of correlation. Correlation means "how good" one variable can be predicted from another variable. In fact, the goodness of fit R^2 is numerically equal to the square of Pearson correlation (rho).
By looking either of the numbers (R^2 or rho), you can conclude that there is a very good (linear) correlation among two variables and one can be almost perfectly predicted from other. By looking at the line (red or blue line, say), you can easily see that when one variable increases, the other too (in mathematical term, the slope of the line is +ve). This information is also conveyed by the sign (positive) of R^2.
Thank you Santosh Anand for your reply. I do understand what you wrote. But, what I intended to ask is, what does this mean?
I understand that there is very good (linear) correlation among two variables and on variable can be predicted from other. What's Biological interpretation?
Some normalization methods take into account the libray size in the calculation of their normalization factors, and other methods do not. That is the difference between RLE and MRN methods on the one side, and TMM an the other side. Nevertheless, the egdeR package (which uses TMM) also take into account the library size to normalize but this do not appear in their "normalization factors".
Finally, the correlation coefficient hasn't really a "biological" meaning but a "statistical" one. Indeed, it only shows that some normalization factors are linked with the library size and others are not.


Thank you Santosh Anand for your reply. I do understand what you wrote. But, what I intended to ask is, what does this mean?
I understand that there is very good (linear) correlation among two variables and on variable can be predicted from other. What's Biological interpretation?