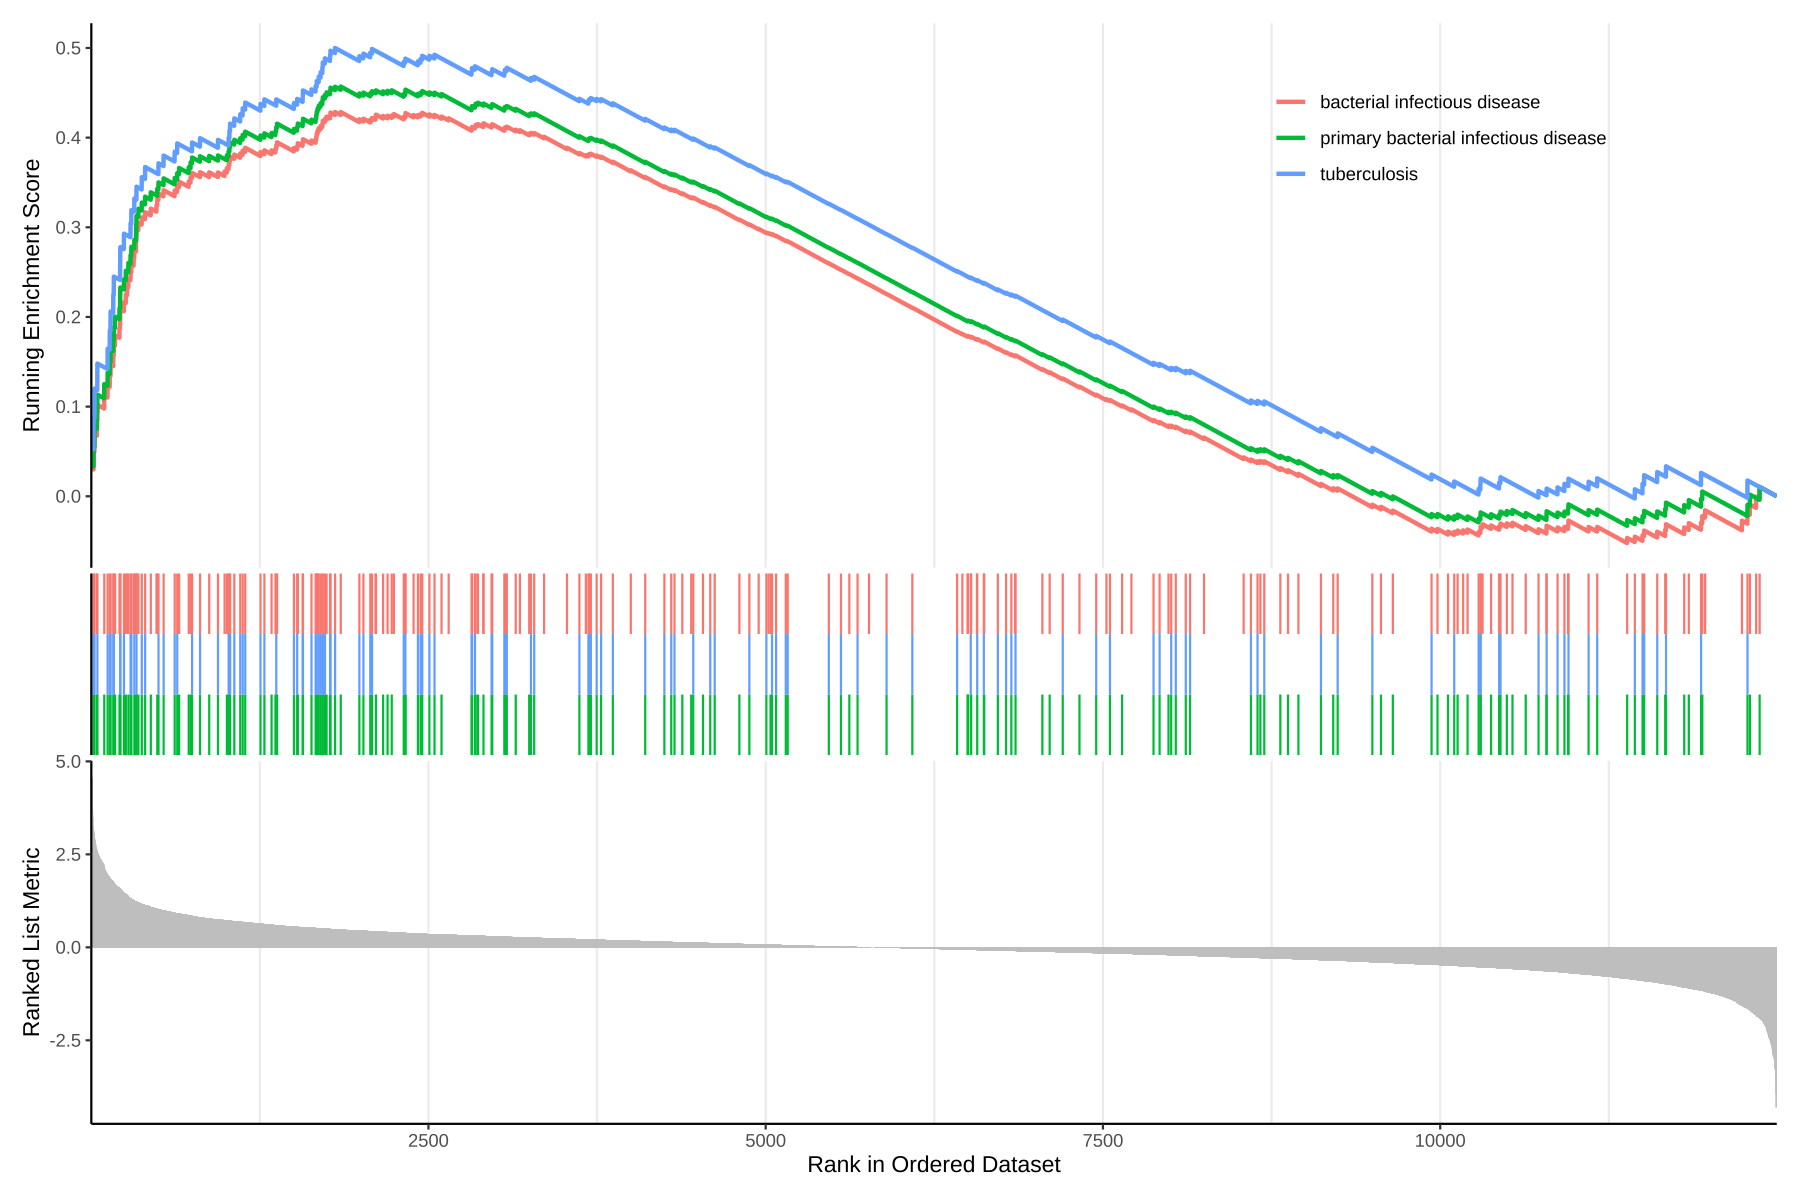
For example in the figure I provided, there are 3 pathways presented in the figure. Those pathways are from one gsea analysis. What if I want to make the similar figure but pick some pathway from multiple gsea analyses. Sorry I made this unclear.
Hi
I am trying to use gseaplot2 to create a figure that contains multiple analyses, like RNAseq and chipsep, so the figure has both RNAseq pathway and CHiPseq pathway. How to do that?
Thanks,
Shikan
1 answer
The documentation associated to the figure you linked explains in detail how to do this plot. Read this page carefully:
15 Visualization of functional enrichment result
If you are in a hurry, go directly to:
15.10 running score and preranked list of GSEA result
If you are unsure how to apply this to your data, or if you run into particular problems, please be specific and explain in detail what are your difficulties.
Hi There!
Did you find a way to get it? I am also interested on it, if it is possible.
Log in to answer this question.