cluster profiler for pathway analysis in scRNA Seq
Dear Community, I am trying to show pathway expression in 6 clusters that I identified in disease and control and would like to compare the corresponding clusters.
I followed this post 438466 and used Pratik 's solution. Which gives me a plot only for the disease. However, I would like to produce a plot as shown in the clusterprofiler vignette under 14.2 Cluster Profiler Vignette . Like this:
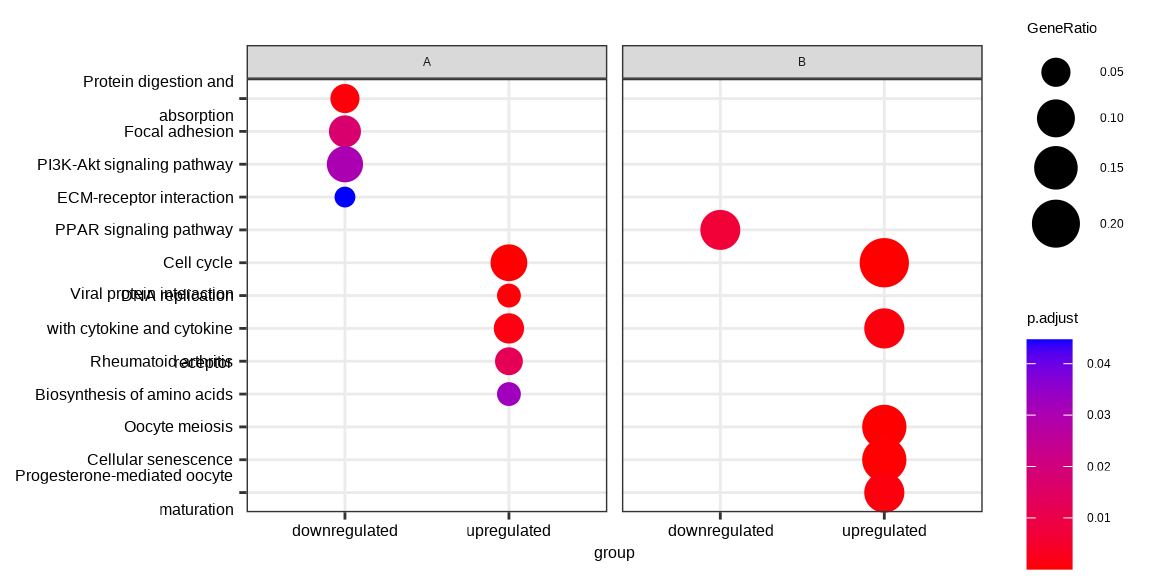
This is my code but I don't know how to properly merge the two individually extracted DEG lists for the clusters from disease and control. Any help is really appreciated.
#Disease
FBSSC@misc$markers <-  FindAllMarkers(FBSSC, only.pos = TRUE, min.pct = 0.25, logfc.threshold = 0.25)

FBSSC@misc$markers %>%
  group_by(cluster) %>%
  top_n(n = 100, wt = avg_log2FC) -> top100SSC
top100SSCpval <- subset(top100SSC, rowSums(top100SSC[5] < 0.05) > 0)

df1 <- top100SSCpval[,7:6]
dfsample1 <- split(df1$gene,df1$cluster)
length(dfsample1)

dfsample1$`FB1` = bitr(dfsample1$`FB1`, fromType="SYMBOL", toType="ENTREZID", OrgDb="org.Hs.eg.db")
dfsample1$`FB2` = bitr(dfsample1$`FB2`, fromType="SYMBOL", toType="ENTREZID", OrgDb="org.Hs.eg.db")
dfsample1$`FB3` = bitr(dfsample1$`FB3`, fromType="SYMBOL", toType="ENTREZID", OrgDb="org.Hs.eg.db")
dfsample1$`FB4` = bitr(dfsample1$`FB4`, fromType="SYMBOL", toType="ENTREZID", OrgDb="org.Hs.eg.db")
dfsample1$`FB5` = bitr(dfsample1$`FB5`, fromType="SYMBOL", toType="ENTREZID", OrgDb="org.Hs.eg.db")
dfsample1$`FB6` = bitr(dfsample1$`FB6`, fromType="SYMBOL", toType="ENTREZID", OrgDb="org.Hs.eg.db")
genelist <- list("FB1" = dfsample1$`FB1`$ENTREZID,
                 "FB2" = dfsample1$`FB2`$ENTREZID,
                 "FB3" = dfsample1$`FB3`$ENTREZID,
                 "FB4" = dfsample1$`FB4`$ENTREZID,
                 "FB5" = dfsample1$`FB5`$ENTREZID,
                 "FB6" = dfsample1$`FB6`$ENTREZID)

#Control
FBH@misc$markers <-  FindAllMarkers(FBH, only.pos = TRUE, min.pct = 0.25, logfc.threshold = 0.25)

FBH@misc$markers %>%
  group_by(cluster) %>%
  top_n(n = 100, wt = avg_log2FC) -> top100Control
top100Controlpval <- subset(top100Control, rowSums(top100Control[5] < 0.05) > 0)

df2 <- top100Controlpval[,7:6]
dfsample2 <- split(df2$gene,df2$cluster)
length(dfsample2)

dfsample2$`FB1` = bitr(dfsample2$`FB1`, fromType="SYMBOL", toType="ENTREZID", OrgDb="org.Hs.eg.db")
dfsample2$`FB2` = bitr(dfsample2$`FB2`, fromType="SYMBOL", toType="ENTREZID", OrgDb="org.Hs.eg.db")
dfsample2$`FB3` = bitr(dfsample2$`FB3`, fromType="SYMBOL", toType="ENTREZID", OrgDb="org.Hs.eg.db")
dfsample2$`FB4` = bitr(dfsample2$`FB4`, fromType="SYMBOL", toType="ENTREZID", OrgDb="org.Hs.eg.db")
dfsample2$`FB5` = bitr(dfsample2$`FB5`, fromType="SYMBOL", toType="ENTREZID", OrgDb="org.Hs.eg.db")
dfsample2$`FB6` = bitr(dfsample2$`FB6`, fromType="SYMBOL", toType="ENTREZID", OrgDb="org.Hs.eg.db")
genelist <- list("FB1" = dfsample1$`FB1`$ENTREZID,
                 "FB2" = dfsample1$`FB2`$ENTREZID,
                 "FB3" = dfsample1$`FB3`$ENTREZID,
                 "FB4" = dfsample1$`FB4`$ENTREZID,
                 "FB5" = dfsample1$`FB5`$ENTREZID,
                 "FB6" = dfsample1$`FB6`$ENTREZID)


both.dfs <- c(dfsample1, dfsample2)
group = c("Disease", "Disease", "Disease", "Disease", "Disease", "Disease", "Control", "Control", "Control", "Control", "Control", "Control" )
both.dfs <- cbind(both.dfs, group)
both.dfs
KEGG <- compareCluster(genelist, data=both.dfs~group, fun="enrichKEGG")
dotplot(KEGG, x="Cluster") + facet_grid(~group)here
Thank you in advance! Cheers Marvin
• 2,158 views
•
link
0 answers
No answers yet.
Log in to answer this question.
I think maybe you have to add the group parameter before merging the two data frames.