This is pretty badass. Thanks!
The only thing I wish it had was an option to show the mutation syntax provided on top of the lollies (perhaps at a 45 degree angle).
• 0 views
•
link
Please let me know any tools or R packages that can create a mutation diagram showing mutations in protein domains like this figure from the MSKCC cBio Cancer Genomic Portal? Thanks in advance

Pfam provides an online tool to not only generate the domain information in JSON format, but to draw the lollipop diagram using javascript as well. They have more information here.
IMHO, not as pretty as cBioPortal's but it gets you close to a solution.
EDIT / SHAMELESS PLUG: After seeing the data available and how easy it'd be, I made my own quick tool to fetch the data and draw the diagram for me in a style similar to cBioPortal - feel free to fork it and add features: https://github.com/pbnjay/lollipops
Example output (w/ labels per the comments)

This is pretty badass. Thanks!
The only thing I wish it had was an option to show the mutation syntax provided on top of the lollies (perhaps at a 45 degree angle).
Just pushed an update with the labels for ya - added an image to my answer above to show it off.
The tool is amazing. Thank you very much! Why the counts do not show up when I specifiy @2? it turns out the 45 degree angle only work for svg file but not for png, right?
Hi there, I am currently using your github code and I am wondering if it is possible to change the text - for example changing P53 DNA-binding domain to something shorter.
amazing tool. I have a few mutations that are very close by. Is there a way to prevent overlapping of the labels?
Thanks
The cBIO portal team recently released a web based tool to generate lollipop diagrams.
The problem with mutation mapper is that the mutations are mapped to the longest transcript. Meaning that if you have a gene with multiple transcripts, the mapping to the domains of the shorter transcripts will be completely wrong!
Hi
We found ourselves in the same need, we wanted such a plot (JavaScript). Thus, I add our solution, Mutations Needle Plot. The library creates an SVG image (with D3), which then may be downloaded.
You will need npm in order to be able to install & run the library.
Examples may be found in the snippets folder or also the index.html - The one displayed here below

My colleague @SolenaLS recently asked me to write something like this: (uniprot+SVG+javascript : ) http://lindenb.github.io/pages/uniprot/paintsvg.html
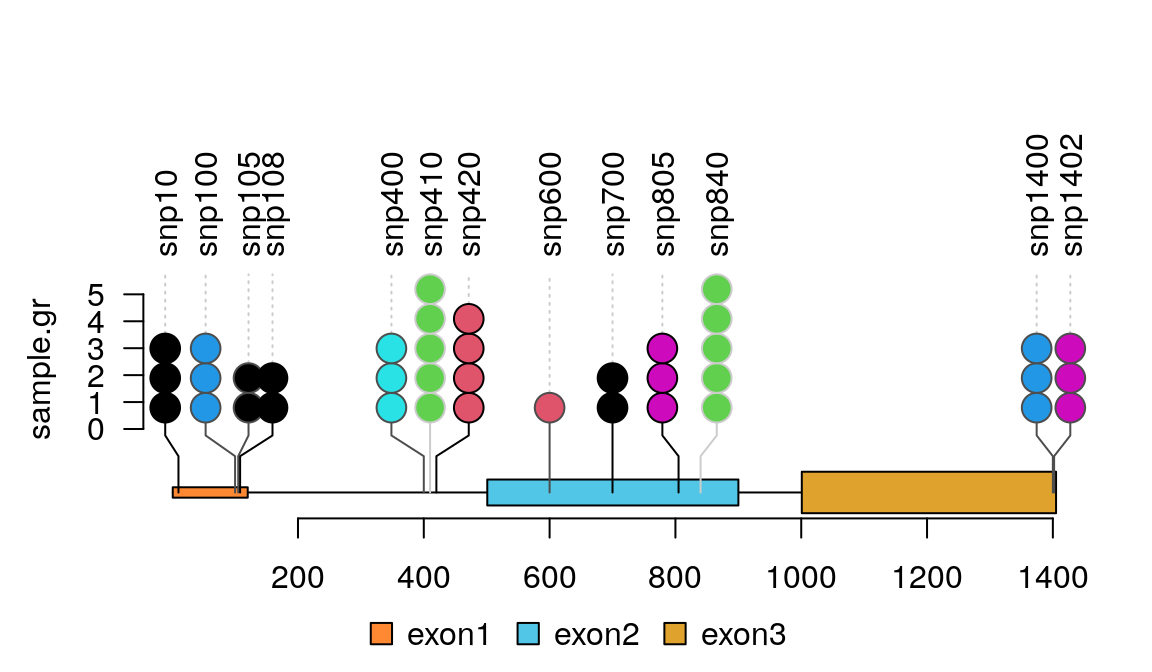
There's a developmental version of this type of diagram using R here, the function is called lolliplot.
Also in bioconductor devel branch. An example visual can be viewed from the vignette found here.
Hi, do you know how to change protein framework by yourself rather than the default version from ensembl? Because I think the default version is too complicated and not simple and direct enough.
Dear,
Colleagues have listed rectangular representations. I have recently published a circular version of such plots. Here is the website: http://i-pv.org/
And here is an example: http://i-pv.org/FOXP2.html
You can also search for I-PV for the posts in Biostar.
I hope this helps
R packages:
Log in to answer this question.
I'm not aware of a specific package but I have made something very similar to this just using base graphics, i.e.
rect, after moving the x-axis down withmgp, plot withtype="h"for the vertical lines... it was quite straightforward.Search your favorite search engine for "lollipop plot" or build your own, as described in another answer.
Thank all for the answers. Based on your suggestion, I found the R package MethVisual for visualization and exploratory statistical analysis of DNA methylation profiles by Arie Zackay and Christine Steinhoff. It will give me some direction to build my own code.
Hi did you come up with something good? I looked at MethVisual, but it doesn't seem really straightforward to get to the cBio picture from there... Thanks if you can share some code!
Please PM me your email.
I have been confused by the method of plotting mutations. Could you share your code with me? Thank you very much!
Could you share the code to do the same.
Thanks
Saurabh
Could you share the code to do the same
Thank U
Daniel
Related post at StackOverflow: