Question About How To Draw A Phylogenetic Tree With Gradual Change Of Color
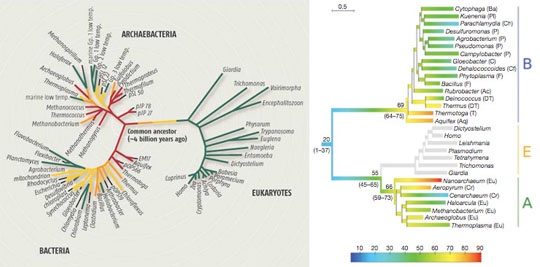
Does anyone have any idea about how the following figure (especially the right one) is drawn? I think the gradual change of the color within one branch mighe be a difficulty in drawing the figure.
• 5,970 views
•
link
1 answer
Presuming you want the clours to be derived from some data you've estimated for the tips/edges of the tree you could use the function plotBranchbyTrait in the R libraty phytools.
eg
library(phytools)
library(MASS)

set.seed(890)
tr <- rcoal(50)
tip_vals <- mvrnorm(Sigma=vcv(tr), mu=rep(0, 50)) #simulate traits by brownian motion down the tree ?vcv to understand this
plotBranchbyTrait(tr,tip_vals, mode="tips", palette="heat.colors")
There are not doubt other tools for this sort of thing on offer in the Phylogenetics Task View
• 142 views
•
link
Log in to answer this question.
if your picture is already available as a vectorial drawing, open it in inkscape an use the gradient tool: http://inkscape.org/doc/basic/tutorial-basic.html