Entering edit mode

5.4 years ago
galchenkova.mari
•
0
Hi, everyone!
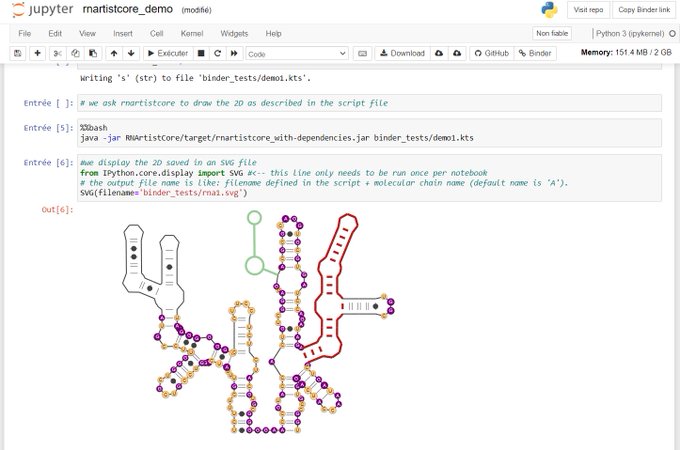
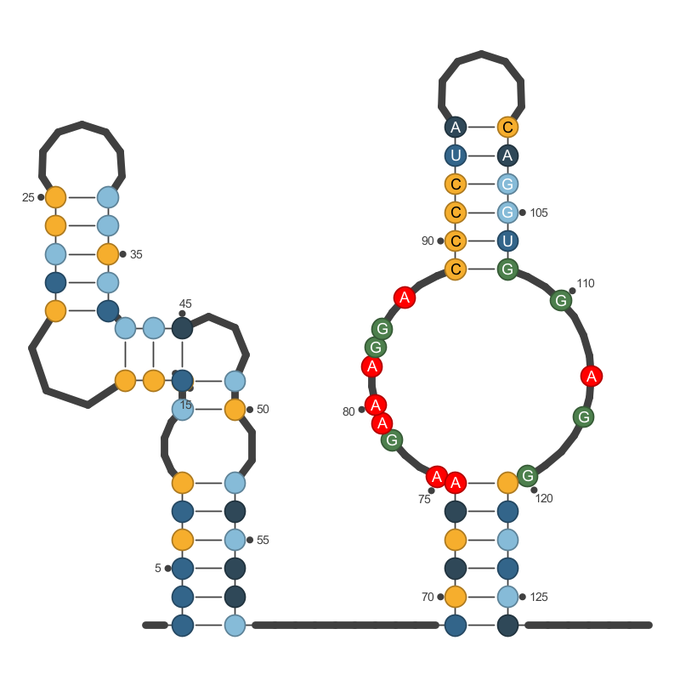
I need some help with forgi library for visualisation of RNA secondary structure.
I'd like from dot-bracket notation with known RNA sequence to plot 2D graph like that you can find here - https://viennarna.github.io/forgi/graph_tutorial.html.
If there any other possibilities to plot it in real-time (for instance, in jupyter notebook avoiding any crossing external scripts), I will be very thankful to learn them!
Thank you in advance


Hello galchenkova.mari!
It appears that your post has been cross-posted to another site: https://bioinformatics.stackexchange.com/questions/5642
This is typically not recommended as it runs the risk of annoying people in both communities.
oh thanks!
I don't know that