Localise up-regulated & down-regulated genes across the genome
3
1
Entering edit mode
6.8 years ago
anu014 ▴ 190

Hi Biostars !

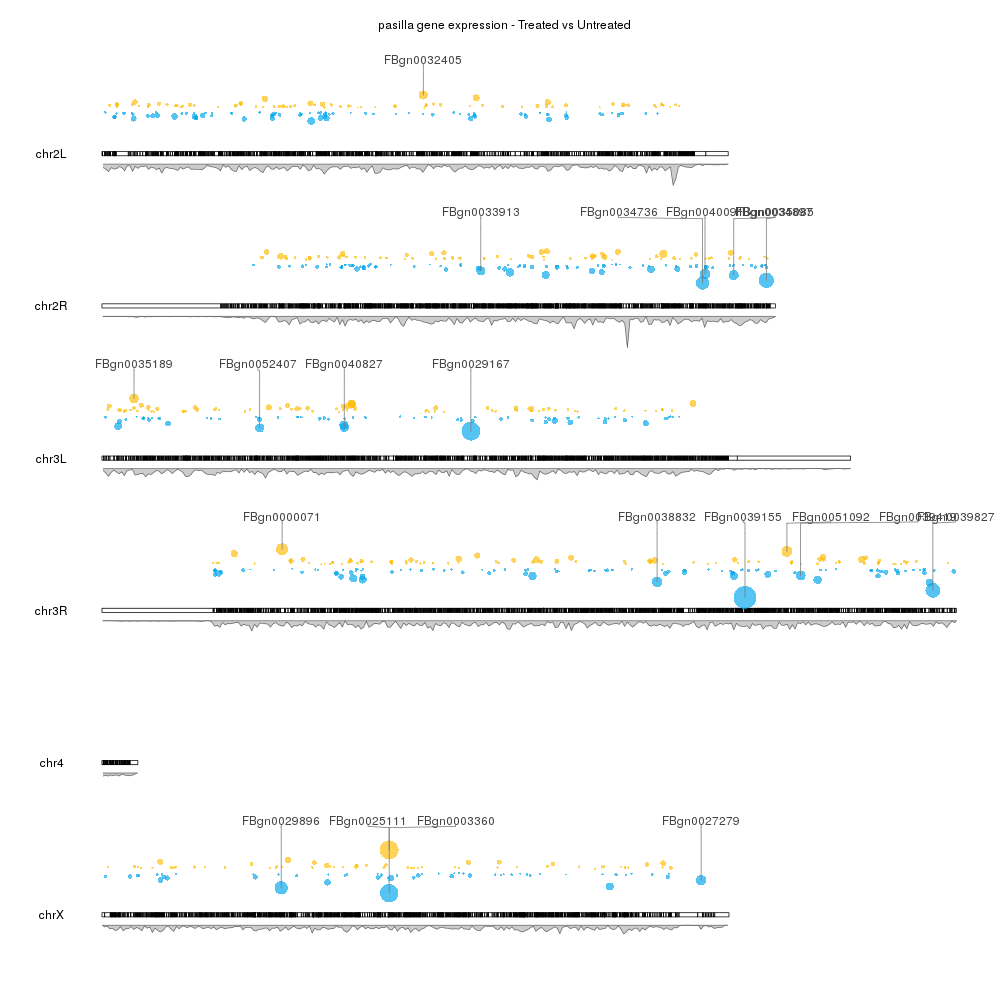
Can anyone tell me how can I plot up-regulated & down-regulated genes across the genome such that the y-axis is fold change & x-axis is position of genes on genome?

Thank you in advance :)

Good Day!

plot RNA-Seq R • 1.8k views
ADD COMMENT
3
Entering edit mode
6.8 years ago
khhgng ▴ 70

Hi.

I found this one helpful : karyoploteR . There are options to adjust the length according to fold changes.

ADD COMMENT
0
Entering edit mode

You can find an example that might be helpful in karyoploteR's Examples and Tutorial site. It has complete code to get to something very similar to what you asked for starting from a DESeq2 analysis (the example is with a D. melanogaster dataset, but it would work the same with any other organism) Example of karyoploteR plot depicting a differential expression analysis in Drosophila

ADD REPLY
2
Entering edit mode
6.8 years ago

You can use ggplot2 by creating a facet for eact chromosome (with facet_wrap() ).

ADD COMMENT
2
Entering edit mode
6.8 years ago
munizmom ▴ 60

As Kristoffer suggested you can use ggplot, I have done something similar using the basic plot,in both cases is easy to customize. If you have a dataframe where you have chr , and another 2 with the start and end locations and in another the fold changes then is easy to represent it. You can subset your dataframe per chromosome (or use a for loop) or plot all together depends of how many Genes you want to represent and how big the plot can get 1) Order the dataframe by chr, then by start and then by end position 2) plot locations in the x, FC in the y axi. In this case if you add the names in the plot and it becomes a mess because you are trying to represent too many an alternative will be plot the Gene names in the x axis and the FC in the Y -axis, and you can color them per chromosome for example, as they are already ordered by start location then you will be able to see where they are locate d but you can add some ablines to the plot to localize regions (chr) or up/down regulated genes by FC cutoff plot(df$x, df$FC, col=groups_chr)

Hope it helps!

ADD COMMENT

Login before adding your answer.

Traffic: 2530 users visited in the last hour
Help About
FAQ
Access RSS
API
Stats

Use of this site constitutes acceptance of our User Agreement and Privacy Policy.

Powered by the version 2.3.6