This is a test version of Biostars. For the public version, visit https://www.biostars.org.
PCA proteomic DEP

Hello everyone, I hope everyone of you had some fun in this summer time. I am back to work and I'm having some issue with DEP tool for proteomic. I have to make a PCA plot, and for some reason I don't see my all my samples in the plot but only some of them. When I run the code

plot_pca(dep, x = 1, y = 2, n = 500, point_size = 4,plot = T)

the plot is this:

PCA

instead of having all of this samples represented below

  sample        PC1        PC2 condition replicate
    1       T_ALL_1 -15.624146  34.899837     T_ALL         1
    2       T_ALL_2 -22.013036  30.657545     T_ALL         2
    3   Leukocyte_1  27.041054   2.388217 Leukocyte         1
    4   Leukocyte_2  27.540329   2.262688 Leukocyte         2
    5   Leukocyte_3  13.255157  16.520955 Leukocyte         3
    6   Leukocyte_4  28.858711  16.422760 Leukocyte         4
    7   Leukocyte_5  -4.799837   9.693203 Leukocyte         5
    8   Leukocyte_6  -5.449344 -26.052015 Leukocyte         6
    9   Leukocyte_7  -5.089086 -19.024295 Leukocyte         7
    10  Leukocyte_8  -4.722665 -25.082722 Leukocyte         8
    11  Leukocyte_9  24.306572  10.368625 Leukocyte         9
    12 Leukocyte_10  41.809260 -15.398383 Leukocyte        10
    13 Leukocyte_11  39.288471 -11.986414 Leukocyte        11
    14 Leukocyte_12  38.284847  -3.482945 Leukocyte        12
    15     Thymus_1 -31.392348 -11.243681    Thymus         1
    16     Thymus_2 -34.516488  -4.929370    Thymus         2
    17     Thymus_3 -25.093346  20.779489    Thymus         3
    18     Thymus_4 -42.765353  -8.536767    Thymus         4
    19     Thymus_5 -14.625431  -5.656757    Thymus         5
    20     Thymus_6 -28.877825  -8.647515    Thymus         6
    21     Thymus_7 -21.969212 -11.729715    Thymus         7
    22     Thymus_8  16.553716   7.777260    Thymus         8

Can somebody please help me with it?

Thank you

pca dep

Try increasing the n value. The plot legend is odd - there are no shapes assigned to a majority of the replicates.

2 answers

Looks like you have more replicates than there are symbols. Just drop replicate from the indicate: plot_pca(..., indicate='condition')

Or switch to a more advanced package like PCAtools by the very active Kevin Blighe

Looks like you have more replicates than there are symbols.

This was my first thought but a simple Google search shows that ggplot2 has > 15 shapes even if you ignore colors and similar looking shapes: image
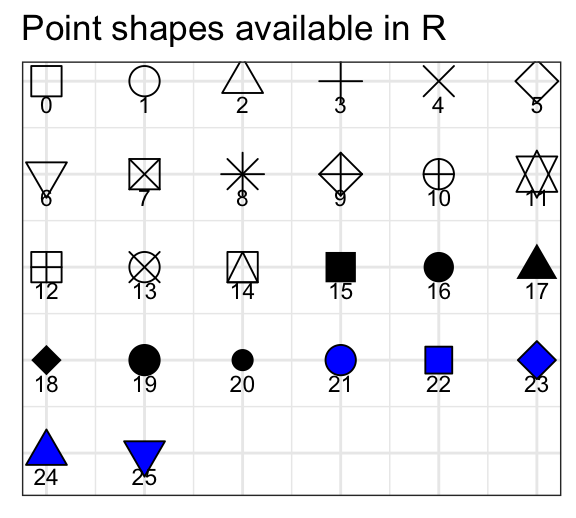
Not a question about what's available, but a question about what the package gives you access to by default.

I read through the code, the package does not limit anything - it merely assigns shape=<variable_name> as an aesthetic.

Since you have more replicates (n=12) than default symbols, you can add ggplot scale_shape_manual(values=seq(...)) to your pca_plot function.

plot_pca(dep, x = 1, y = 2, n = 500, point_size = 4,plot = T) + scale_shape_manual(values=seq(0,11))

# OR to get more defined shapes, you can do sth like this
plot_pca(dep, x = 1, y = 2, n = 500, point_size = 4,plot = T) + scale_shape_manual(values=c(7,8,9,10,11,12,13,14,15,16,17,18))

Since you have more replicates (n=12) than there are symbols,

says who? R has >12 symbols. See the image in my previous comment.

I did not say R or ggplot has less than 12 symbols. I wonder what made you understand like that. My understanding is that, in ggplot you can even plot more symbols than what you have posted above. See this- enter image description here

One could probably even plot Trump's mugshot as a symbol, to be honest with you. That would make Nature without peer review.

Right so what are you saying? I went through plot_pca code and there is no restriction on what symbols are allowed.

Log in to answer this question.