This is great. Thank you Chirag!
• 0 views
•
link
This seems simple maths behind, But I always get confused with the terminology of "Fold change", "Log Fold Change" (LFC), and "Percentage of Change"., When I see some of the figure descriptions given in volcano plots, specially X axis, I get confused.
i.e. Page 64

When I google, I found this figure is easy to understand, but the figure description does not make sense for me.

For example If we take two-fold change; isn't this the way we calculate LFC;
LFC = Log2 (Foldchange) = Log2(2) =>1
if X axis is in Log2 fold change, shouldn't two-fold change denotes at ± 1? Why they denote 2 fold change cutoff line in ± 2?
Below VP; Fold Change greater than 2 times and significant P value less than 0.05
See this example:
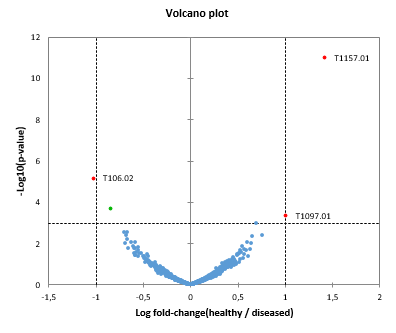
and this:
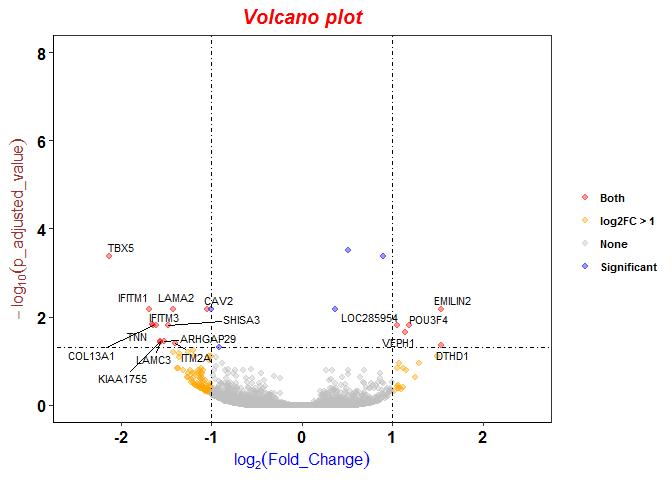
Could someone help me to understand this terminology ( "Fold change", "Log Fold Change" (LFC), and "Percentage of Change". ) easily with an example?
All the figures you posted above shows same thing which is Log2(FoldChange). Although 1st figure x axis labeled "Fold Change" it is Log2(FoldChange). Without log you cannot have negative values (It means down regulated genes).
One of the reasons to use log2(FoldChange) and not FoldChange only is to use same magnitude for UP and DOWN regulated genes. See the example below.
Let's say you have 2 genes one GeneA and GeneB.
GeneA has FPKM (or RPKM) value is 100 in control and value 200 in treatment.
FoldChange for GeneA is : (treatment/control = 200 / 100 = 2 ).
GeneB has FPKM (or RPKM) value is 200 in control and value 100 in treatment.
FoldChange for GeneB is : (treatment/control = 100 / 200 = 1/2).
As you can see from FoldChange values, GeneA is 2 fold UP while GeneB is 1/2 (0.05) fold down. Comparison of value 2 and 0.05 are less interpretable to indicate UP and DOWN gene regulation. However, normalising both UP and DOWN on log2 make UP and DOWN comparisons easy. For e.g. Log2FC for GeneA is 1 and GeneB is -1 which makes fold change comparable and so easy to plot figures (volcano , heatmap etc. ).
In most RNAseq people use 1.5 or 2 foldChange cutoff. It means Log2FC 0.6 and 1 respectively.
In short, log2FC value >= 0.6 & =< -0.6 suggests 1.5 fold cutoff and log2FC value >= 1 & =< -1 suggests 2 fold cutoff.
This is great. Thank you Chirag!
Hey @ Wuschel
These answers here helped me a lot in the beginning to understand these terminologies that I even saved in my browser bookmarks.
Question: Difference between FC and LogFC
Question: Report and compare log2FC vs FC
I think it can help you about log2FC and FC, but about "% of change" I never read anything about it.
Another thing, if you want to learn how to create beautiful volcano plots read this tutorial "Tool: EnhancedVolcano: Publication-ready volcano plots with enhanced colouring and labeling"
Thank you Leite :) Very kind of you. But stil the confusion in X axis cutoff lines, I am lost. Figure description says log2FC / 2 FC, then in the figure, some mark the cutoff line at 1 other at 2
The cutoff is add by the author of the paper, we commonly use log2FC ≥ 2. However, in other studies they may use a smaller cutoff, such as 1.
Also note that the adjusted p-value may also change in each study (in Y axis,).
Example: FDR < 0.05 & log2fc > 1/log2fc < 1
So you might be wondering, what cutoff point to choose? Read this answer from my friend @Kevin as well as that other answer.
Log in to answer this question.
Read the labels of your second graph carefully. The x axis is not labeled log told change.
The formatting of your question was / is fairly messy - I have tidied it somewhat. Also, did you not already post this on the Bioconductor Support forum?
Hi Kevin Thanks. Yes I googled this, What I confused is in some publications, Figure description says log2FC / 2 FC, then in the figure, some mark the cutoff line at 1 other at 2. So I am confused. Sorry about posting this Q here. I had to delete BC Q, as I tagged several packages and one of the authors was not happy about it.
I see, the labeling in the figure is just imprecise and leave some room for doubt, but the general message is still conveyed [by the figure]. It is just a minor inconsistency on the part of the person (or machine) who created the figure. I think that you genuinely understand the differences between linear and log fold changes.
Thank you Kevin as always.