Yeah for gene track! Thanks for taking the time to give the authoritative answer.
• 0 views
•
link
I want to make a circos plot of a small genomic region and would like to draw the transcripts in that region as thick exons connected by thin introns. I have looked at using tiles, but it does not seem that I can control how related tiles are drawn with respect to each other. Has anyone else successfully drawn transcript models with circos?
I have looked at using ggbio to do something similar, but ggbio does not yet offer different scaling in different parts of the plot; circos does this well.
Hi guys,
Circos doesn't have a gene track, of the kind you see in UCSC and other browsers.
If you have multiple transcripts across the same position , tiles can't be used to effectively show genes because there is no way to link thin (intron) and thick (exon) tiles together and have them stack correctly.
However, if you have only one transcript per interval you don't need to worry about how tiles stack. Everything can be drawn at a single radial position. In this case, tiles will work, as will highlights. You can change the 'thickness' parameter in a rule to change the width of the tile to make the exons thick and introns thin.
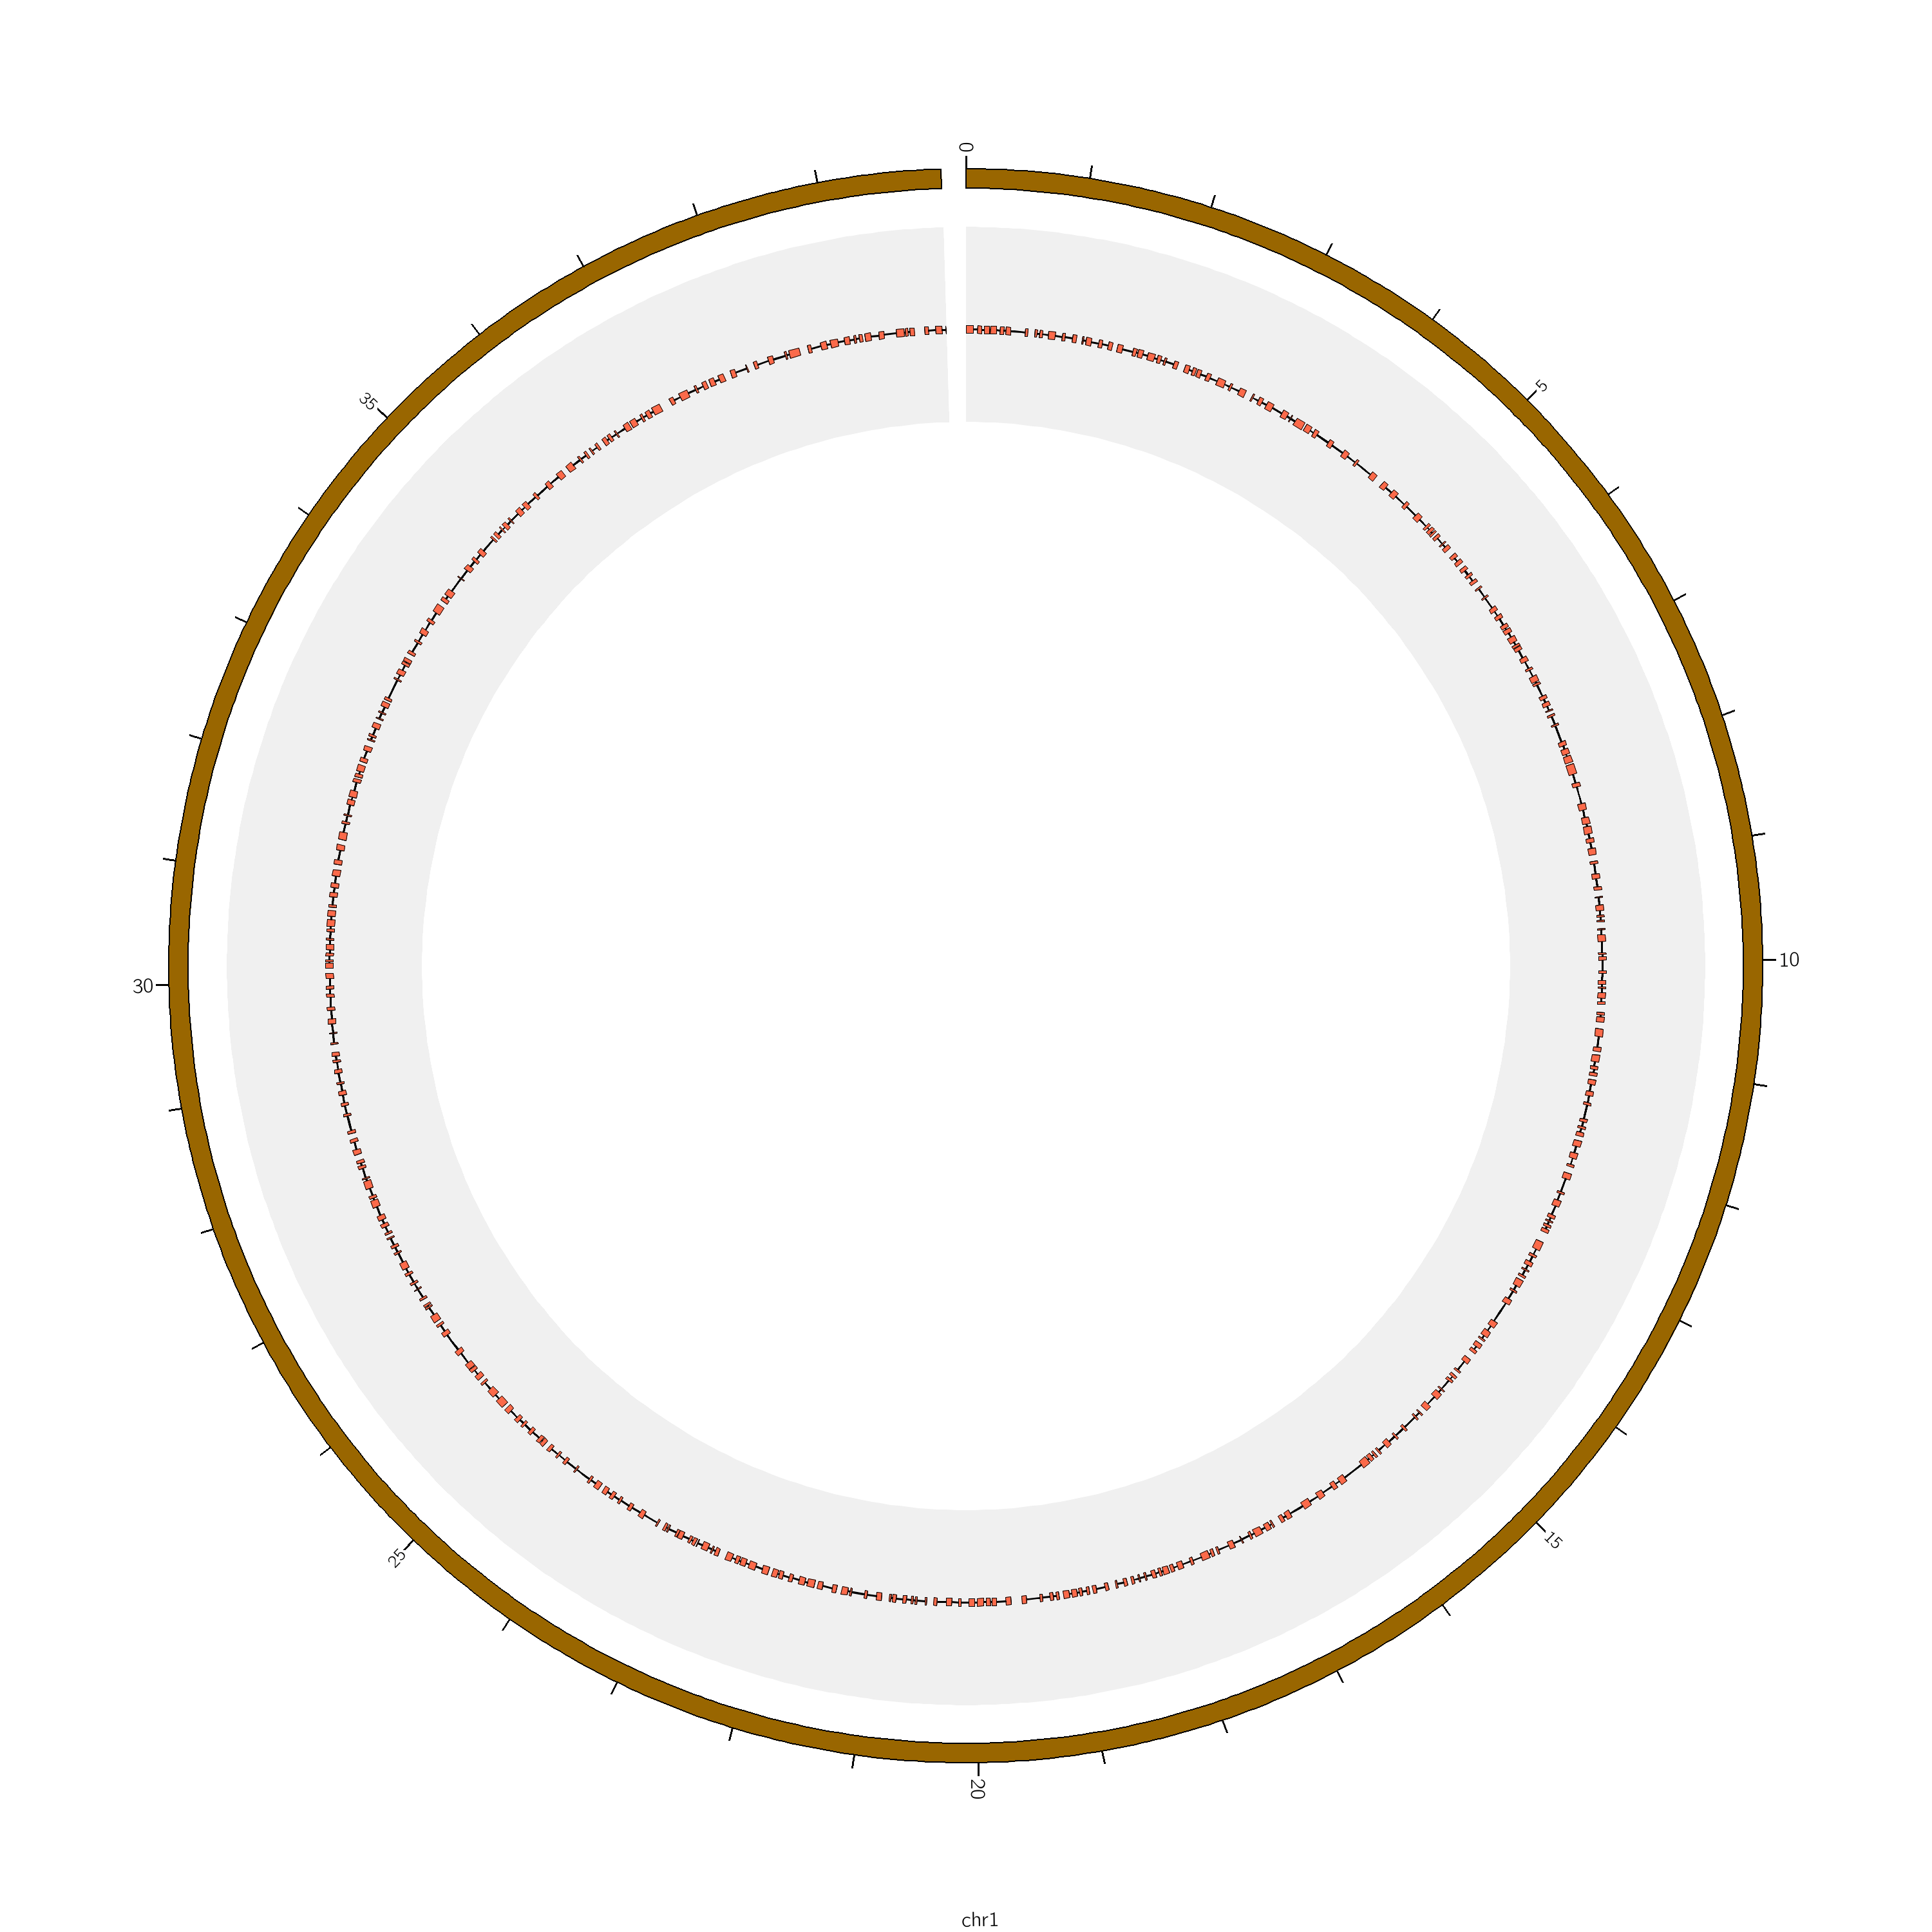
I've put the conf/data files for this example at
single-layer transcript track data/conf
The real solution is me adding a real gene track :)
Yeah for gene track! Thanks for taking the time to give the authoritative answer.
Martin, Thanks so much for making Circos and being such a great promoter of informative graphics to communicate data! Your dedication to keeping up with lots of questions on your Google Groups Page (and here!) is also much appreciated!
I'm trying to create a transcript track as well. Has Circos been updated to include a gene track? Thank you
Sean, I keep thinking tiles in circos is the way you want to go, if you want to display exons & introns within a genomic region. Finding the tutorial pages within the tutorial pages on the circos site can be a challenge. Did you come across these pages?
http://circos.ca/documentation/tutorials/2d_tracks/tiles/images
http://circos.ca/documentation/tutorials/2d_tracks/tiles/configuration
That looks sort of UCSC-browsery, no?
Yep, pretty close. Tiles are one of the building blocks, but I am looking to have introns connect exons for each transcript. I guess I'll have to simply play with things until I get it right.
Hi Sean,
I am looking for something like it now... Did you get to what you tried with circos?
Log in to answer this question.
I would be interested in this also. The learning curve for Circos is tough, but I'm pulling through it. Just getting the dependencies working was rough enough.
Do you have a good example from a paper I could try to dissect? A citation for a paper with a figure you want to try to emulate or do something similar would be great. There are numerous examples from the tutorial files and the Circos Google Group is also a good place to check.
I didn't see an example in the tutorials that matched my needs. I want a UCSC browser view, but in circos, basically.