Hi Biostars,
I would like to take the output of Galaxy's Metagenomic Analyses > Fetch Taxonomic representation and make a Taxonomic tree that contains abundance information. For display, I could then experiment with the the many excellent visualization softwares out there ( i am particualry interested in the ETE2 library) . This question is very similar to a previous question where the author was reccommended to use iTOL for a similar purpose. I am wondering, however, if it possible to generate an abundance-information-containing Newick tree directly from the Galaxy Metagenomic Analyses output - ideally to provide a flexible replacement for the current taxonomic abundance-visualization tool. The values in the Newick tree could actually come from the
The data output is a table with a few identifier collumns and then the kindom/phlyum/class.... Here are a few lines (sorry that it wraps):
contig00428    562    root    Bacteria    n    n    n    Proteobacteria    n    n    Gammaproteobacteria    n    n    Enterobacteriales    n    n    Enterobacteriaceae    n    n    n    Escherichia    n    Escherichia coli    n    42469
contig00073    562    root    Bacteria    n    n    n    Proteobacteria    n    n    Gammaproteobacteria    n    n    Enterobacteriales    n    n    Enterobacteriaceae    n    n    n    Escherichia    n    Escherichia coli    n    42945
contig00672    562    root    Bacteria    n    n    n    Proteobacteria    n    n    Gammaproteobacteria    n    n    Enterobacteriales    n    n    Enterobacteriaceae    n    n    n    Escherichia    n    Escherichia coli    n    146126
contig00143    562    root    Bacteria    n    n    n    Proteobacteria    n    n    Gammaproteobacteria    n    n    Enterobacteriales    n    n    Enterobacteriaceae    n    n    n    Escherichia    n    Escherichia coli    n    287840
contig01215    562    root    Bacteria    n    n    n    Proteobacteria    n    n    Gammaproteobacteria    n    n    Enterobacteriales    n    n    Enterobacteriaceae    n    n    n    Escherichia    n    Escherichia coli    n    290448
Alternatively the 'Summarize Taxonomy tool' provides the following:
superkingdom    Eukaryota    9
superkingdom    Viruses    1
kingdom    Fungi    2
kingdom    Metazoa    5
kingdom    Viridiplantae    1
subkingdom    Dikarya    2
superphylum    Bacteroidetes/Chlorobi group    22
superphylum    Chlamydiae/Verrucomicrobia group    6
superphylum    Fibrobacteres/Acidobacteria group    8
phylum    Acidobacteria    8
phylum    Actinobacteria    9
phylum    Apicomplexa    1
any ideas would be appreciated,
zach cp
galaxy
taxonomy
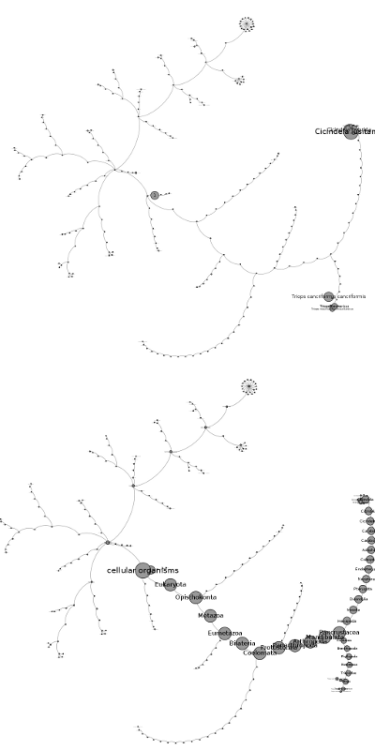
Zach, how big (# of terminal nodes) are your trees?
jhc, the tree varies depending on the experiment but a few thousand is typical. I actually came across your Taxonomy Lookup and have been playing with it. It is similar to Pierre's but outputs the newick tree which I can then use with the ETE2 library for custom layout. (which is awesome - thanks!).