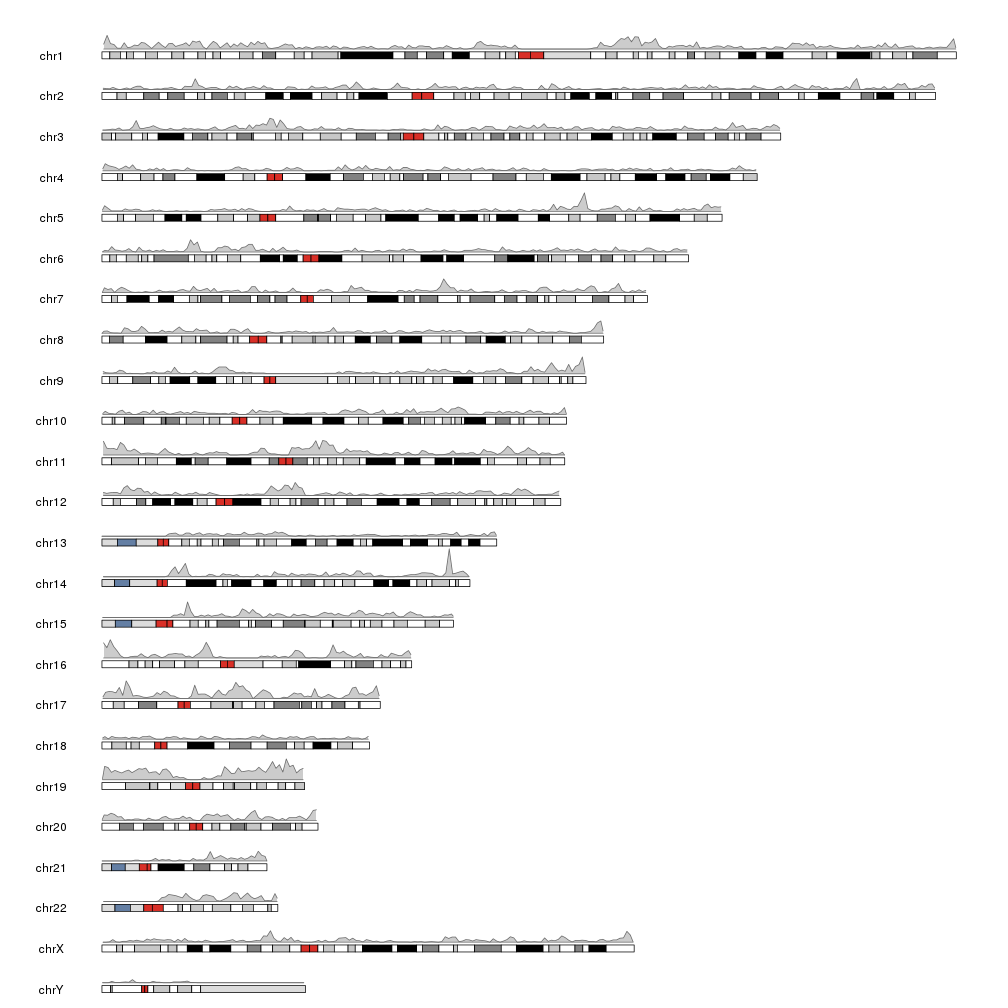
Yes that is a good option for chromosome visualisation. What is not clear to me is what is the format of the gene density input file that is needed. For the examples in karyoploteR they use human data which are already loaded in the package. Do you have any suggestion on how the input file of gene/feature density should be formated?
Visualizing gene density along the chromosome
I want to visualize gene density along several chromosomes as a heatmap like the supplementary figure 13 in this link https://static-content.springer.com/esm/art%3A10.1038%2Fs41588-019-0405-z/MediaObjects/41588_2019_405_MOESM1_ESM.pdf
Hope someone could recommend some python or R packages for doing that. Great thanks!
• 4,529 views
•
link
1 answer
You should try karyoploteR. It comes with a tutorial specifically for plotting the density of genes along the genome.

This is just one visualization. The karyoploteR package has a lot of different settings to change the exact appearance.
• 0 views
•
link
• 0 views
•
link
Hi Midge,
Guess it can be a GRanges object, which can be created from a data frame using GenomicRanges::makeGRangesFromDataFrame():
> library(karyoploteR)
> df <- data.frame(
+ chr = c("chr1", "chr3", "chr5", "chr7", "chr9"),
+ start = 11:15,
+ end = 20:24,
+ strand = c("+", "-", "+", "-", "+"),
+ gene_id = 1:5
+ )
> df
chr start end strand gene_id
1 chr1 11 20 + 1
2 chr3 12 21 - 2
3 chr5 13 22 + 3
4 chr7 14 23 - 4
5 chr9 15 24 + 5
> gr <- GenomicRanges::makeGRangesFromDataFrame(df)
> gr
GRanges object with 5 ranges and 0 metadata columns:
seqnames ranges strand
<Rle> <IRanges> <Rle>
[1] chr1 11-20 +
[2] chr3 12-21 -
[3] chr5 13-22 +
[4] chr7 14-23 -
[5] chr9 15-24 +
-------
seqinfo: 5 sequences from an unspecified genome; no seqlengths
> kp <- plotKaryotype(genome = "hg19")
> kp <- kpPlotDensity(kp, gr)
• 0 views
•
link
Log in to answer this question.
If Perl is also OK for you: DensityMap.