Hello everyone,
I have generated a heatmap for a specific list of marker genes I am interested in using the code below:
genesofinterest <- c("ENSG00000170017", "ENSG00000088836", "ENSG00000080493", "ENSG00000164879", "ENSG00000143248", "ENSG00000232995", "ENSG00000124205", "ENSG00000152154", "ENSG00000116675", "ENSG00000180340", "ENSG00000066468", "ENSG00000139329", "ENSG00000139330", "ENSG00000011465", "ENSG00000026025", "ENSG00000039068", "ENSG00000186081", "ENSG00000175793", "ENSG00000189334", "ENSG00000196878", "ENSG00000073282", "ENSG00000186847", "ENSG00000171346", "ENSG00000135925", "ENSG00000196754", "ENSG00000166670", "ENSG00000175063", "ENSG00000123975", "ENSG00000051128", "ENSG00000106066", "ENSG00000171401", "ENSG00000170477", "ENSG00000171345", "ENSG00000205420", "ENSG00000148346", "ENSG00000143546", "ENSG00000187242", "ENSG00000186442", "ENSG00000167916", "ENSG00000197353")
genesofinterest <- assay(rld.sm)[genesofinterest, ]
mart <- useMart("ensembl","hsapiens_gene_ensembl")
gns <- getBM(c("hgnc_symbol","ensembl_gene_id"), "ensembl_gene_id", row.names(genesofinterest), mart)
row.names(genesofinterest)[match(gns[,2], row.names(genesofinterest))] <- gns[,1]
genesofinterest  <- genesofinterest - rowMeans(genesofinterest)
anno <- data.frame(Diagnosis = rld.sm$diagnosis)
row.names(anno) <- row.names(coldata)
pheatmap(genesofinterest, annotation_col = anno, labels_col=paste(dds.sm$name))
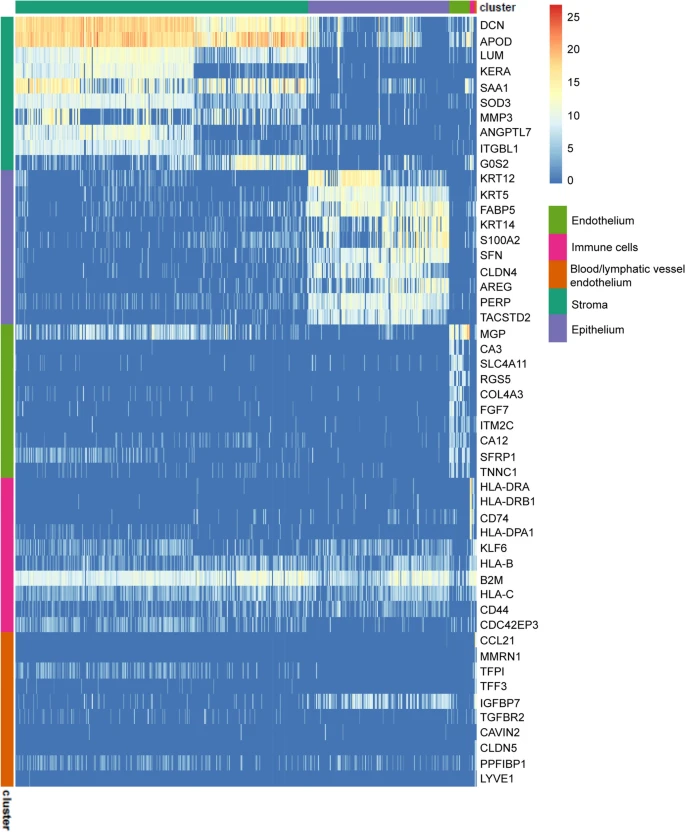
Can someone please assist me as to how I can add row annotations to this heatmap to group genes by their cell marker types?
I'm hoping to generate something similar to this figure: https://media.springernature.com/lw685/springer-static/image/art%3A10.1038%2Fs41598-021-01015-w/MediaObjects/41598_2021_1015_Fig2_HTML.png?as=webp
Many thanks
Nathan
1 answer
You got a lot going on there in that code block. It would be good to specify which libraries you're using. To annotate the rows, you simply need a mapping between genes and the cell types they mark. For pheatmap(), you supply the mapping as a dataframe where the row names are the gene IDs, and the first column holds the cell type. Then you supply this to pheatmap using the annotation_row argument, just like you did for labeling the columns with the annotation_col argument.
Here's a simple toy example:
library(pheatmap)

# create some data
dat <- matrix(rnorm(90), nrow=10, ncol=9)

# label rows
rownames(dat) <- paste0("g", 1:10)

# label columns
colnames(dat) <- paste0("e", 1:9)

# make up a table of gene classifications, for the Rows
celltypes <- data.frame(CellType=c(rep("Stroma", 3), rep("Epithelium", 3), rep("Immune", 4)))
rownames(celltypes) <- rownames(dat)

# make up a table of experiment classifications, for the Columns
experiments <- data.frame(experiment=c(rep("drug1", 3), rep("drug2", 3), rep("control", 3)))
rownames(experiments) <- colnames(dat)

# draw the heatmap with row and column annotations
pheatmap(dat, annotation_row=celltypes, annotation_col=experiments, main="toy heat map")
(I turned off row clustering so you could more easily see the groups).

Log in to answer this question.