Hi @bernatgel
What version of R does this run on? I have 3..5..2 and it seems not to be available for what I have
• 0 views
•
link
I have genomic positions in a tab delimited file as follows:
Chr     Start   End
2       10262865        11801950
2       9637403          10927601
2       25141434        27157396
2       31181368        38044662
2       127808684       129276101
2       236957807       238896574
2       237172736       238896574
First I want to find overlapping segments within these genomic segments in the same file (edit). Then I wish to plot these such that the segments do not overlap on the plot. Is there a tool that can aid in:: 1 Finding overlapping regions within the same file 2. Visualising the segments in a non-overlapping manner?
My attempts at plotting this in R results in the segments occupying the same position
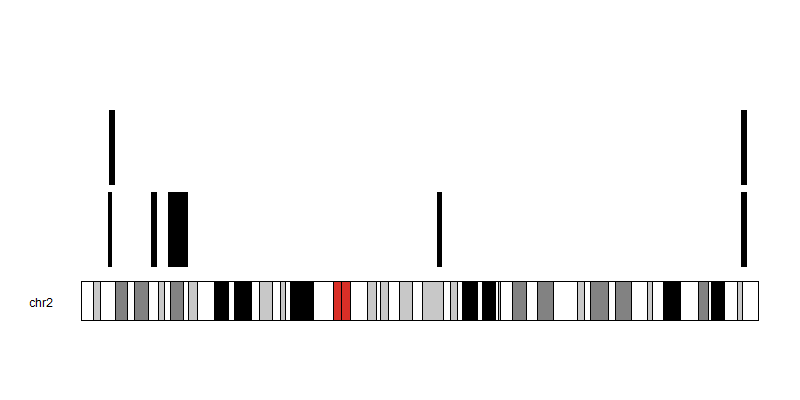
If you want to plot them, you can use karyoploteR. The function kpPlotRegions plot the regions non-overlapping by default and will create the plot I think you asking for.
The first two lines read the data file into a GenomicRanges object and change the chromosome names to the ones used by the default genome (UCSC hg19). plotKaryotype creates the plot and kpPlotRegions adds the region to the plot. At the karyoploteR tutorial you can find more information on how to add more data and customize your plots.
library(karyoploteR)

regions <- toGRanges("regions.txt")
seqlevelsStyle(regions) <- "UCSC"

kp <- plotKaryotype(chromosomes="chr2")
kpPlotRegions(kp, data=regions)
Hi @bernatgel
What version of R does this run on? I have 3..5..2 and it seems not to be available for what I have
It should run without any problem... it's been available for the last few Bioconductor releases.
Did you try with BiocManager::install("karyoploteR")? Since it's a Bioconductor package it cannot be installed with install.packages() but with BiocInstaller::install(). You have the exact code at the karyoploteR landing page.
Thanks. Will give this a shot and see how it pans out
using the tool developped for Simple alternatives for the program Circos http://lindenb.github.io/jvarkit/Biostar336589.html
Hi Pierre,
That looks exactly like what I have in mind. Would that work in the circlize package? I am not too sure that I am able to follow your code
it's not a R package , it's a standalone java progam.
I am not too sure that I am able to follow your code
The program needs a sequence dictionary to know the genome size. I created a fake one using the human chromosome 2 only?
echo -e '@HD\tVN:1.4\tSO:unsorted\n@SQ\tSN:2\tLN:243199373' > tmp.dict
remove the 'Chr' header to create a valid BED file
grep -v Chr input.bed
invoke the program: -a is for 1 rotation / 60 seconds
java -jar dist/biostar336589.jar -a 60 -R tmp.dict <(grep -v Chr input.bed) > out.svg
I should have been clearer in my reply above. There is an R package called circlize, that I think does something similar to the code you have for your program that I had considered as an option and I was wondering if they are similar in how they work to make circular chromosome plots?
The data that I have in the example above is from human chromosome 2. The rest of it is divided into the other autosomal chromosomes. I just wanted to get a handle on how a potential pipeline could work before I combine the data or run it as batches of chromosomes.
So if I have the data as tab delimited files (edited using awk and sed), would that be equivalent to a correctly formatted BED format if I change my exxtension from .txt to bed as I seem to gather you have done here?
Log in to answer this question.
What is the expected output plot for this data?
I would like to see each segment plotted without ovelarying each other, if the start positions for the segments are the same. Eventually I will then try to find the smallest region of overlap between the segments, so that if say I had 8 segments but the first 3 segments share an overlapping region I can find that region and have my segments reduced to 6 unique segments.
You should then try the
reduce()function fromGenomicRangesR package.I tried reduce() and it removes the metada making it hard for me to know which individuals share a given segment. Is there a way of retaining the metadata? From what I gather in the documentation, range reduction causes the names and metadata to be dropped. Or perhaps I should find a workaround for appending the metadata to the ranges?
you can start with that : https://stackoverflow.com/questions/20577492/finding-overlapping-regions-of-chromosome-with-granges