
Dear all,
I have aligned reads to a reference genome with BWA MEM and removed the duplicated reads with SAMBAMBA. I then used samtools to get a coverage distribution of the reads and used a script in R to cluster the coverage. The samtools command was:
samtools depth <aligned_deduplicated.bam> > <file.tsv>
which gives a column with the genomic position and one with the related coverage. By pooling the data with R, I got, for example for the stretch 367,853,177 to 367,853,698, an average of 124,391 reads per base. If I plot this region on IGV though, I get this:
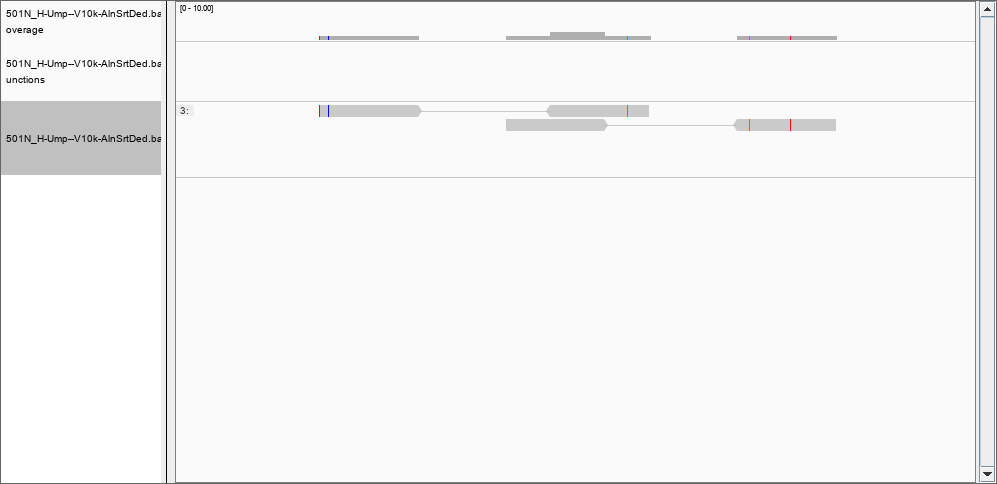
The threshold values for the quality of alignment and mapping are both set to 50, but the figure does not change if I use 0, 1 or 30.
Am I right in assuming that the problem is about the quality of the reads provided by samtools? That is: samtools depth provides all the read coverage for a given position regardless of the quality (both alignment and mapping) whereas IGV filters this information? Maybe the reads are hard clipped, that is why are not shown -- but then, how to show them?
And how can I then used samtools depth with an associated quality value? That is, how can I add a third column to the depth's output that reports the alignment (or mapping or better both) score?
Thank you
See if Alignment or Filtering Prefs help https://software.broadinstitute.org/software/igv/Preferences
Could you separate the reads in the problematic region and load them on IGV to dissect the problem?
and check that 1) This contains as many reads as you expect 2) Load only this "small" bam on IGV to check if it shows there 3) If nothing explains, check the alignment inside the BAMfile and post a some lines which are in BAM but not reported in IGV.
Hello,
first of all have a look at one specific position in the output file of
samtools depthand compare this position in igv with setting mapping quality and base quality threshold to 0 in the preferences. In the same preference tab you should also make sure that duplicates, supplementary alignment and other things are shown.If you start
samtools depthwithout any parameter you will get the help page:As you can see there option to include mapping and base quality into calculation.
fin swimmer
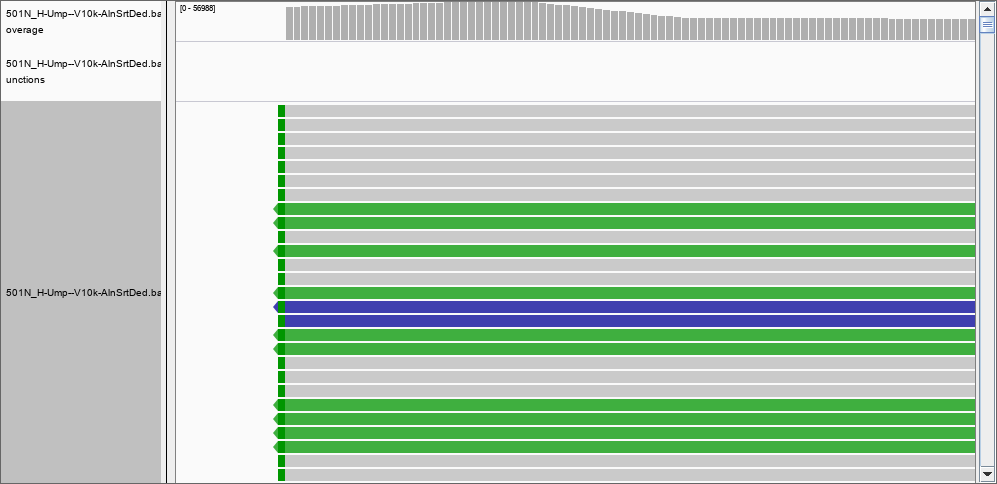
Thank you, by using the -Q flag I was able to remove many of the records previously found; for instance, there is nothing in the region 367,853,177 to 367,853,698 with a quality of mapping of 50. However, the depth file still has two columns only. Would be possible to create a file with position, coverage and quality? I set the thresholds to 0 and removed the filter for the duplications, but still I could not see the 124 000 reads in position 367,853,177 to 367,853,698. However, in position 46480796 I can see the reported 2 reads of coverage: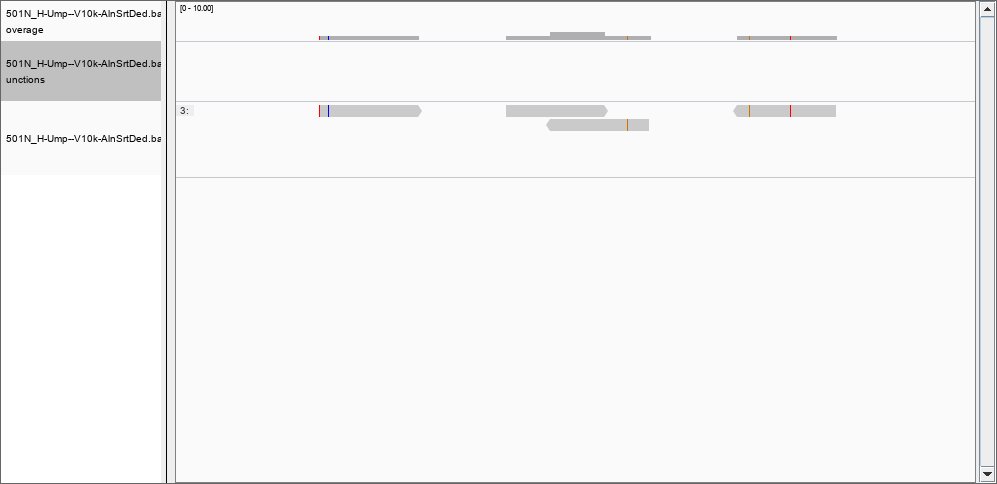 and at position 278016720 a more realistic coverage of 8000 that this time DOES show in IGV.
 The answer must be therefore that IGV DOES filter the reads. What would be a good threshold for mapping? 30? 50? more?
Hello again,
could you please make a screenshot of the preferences in the alignment tab?
Have you checked what
samtools depthreported for this position? Looking there we can bypass any problems with your R script. 124 000 reads in one position would be a very, very high depth. Is this value possible in your data?Instead of asking the question "What mean mapping quality do I have on a given position?" you should asked "How many high quality data do I have on a given position"? In often used cut-off for mapping quality is 20 and for base quality 13. So you could run
samtools depth -a -Q 20 -q 13 input.bam > depth.csv.fin swimmer
sure, here it is: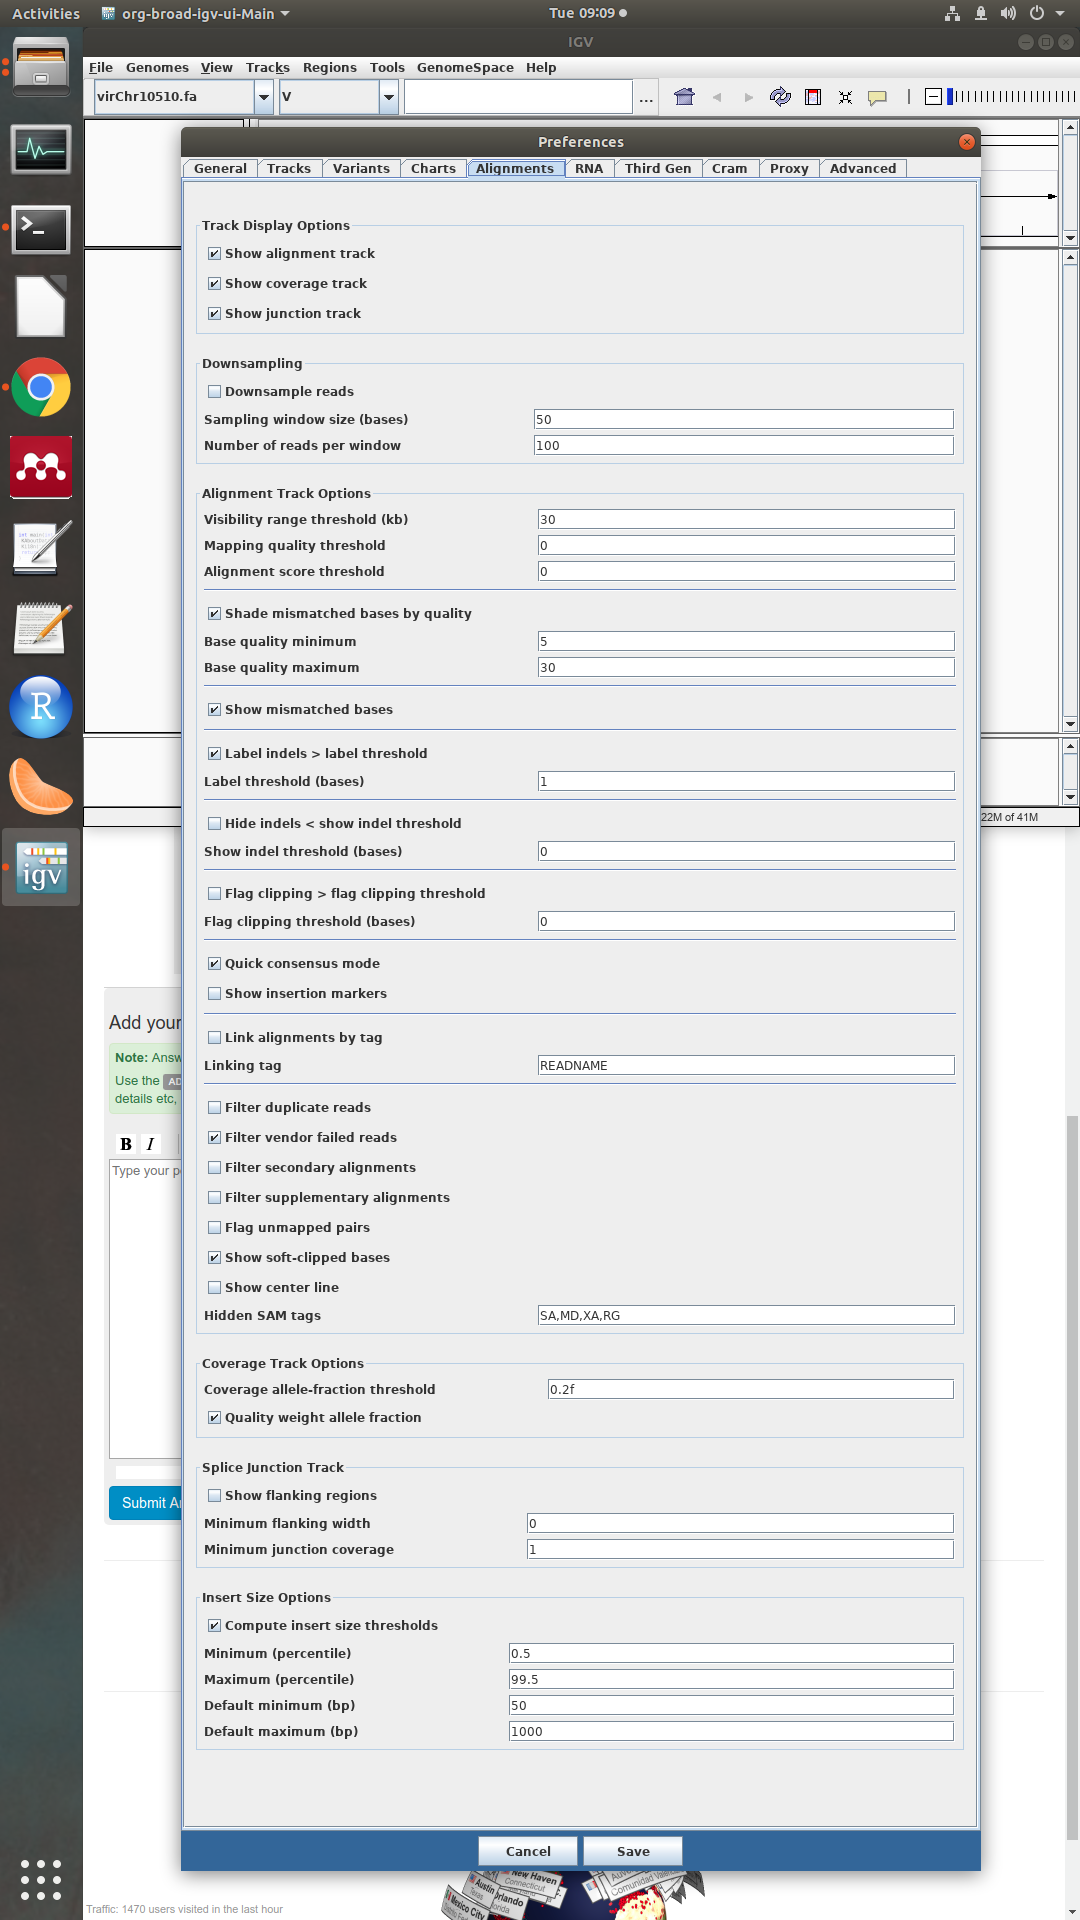 To note that I set the quality thresholds to 0 and filter duplicates is off. IS there a paper with a consensus quality threshold reported? Thanks
Ok, the settings looks good.
Please also answer my answers questions:
fin swimmer
There was indeed a flaw in the R script I wrote, it was not flushing data properly. Now everything looks good. I am filtering the reads by quality and the coverage is again in more reasonable ranges. Tx
You cannot add a third column to
samtools depthit is just not what it was designed to do.I will also say that for high coverage data (like the one you have with a coverage of 124,000x) that also may contain a reads with multiple alignments, duplicates, secondary and supplementary alignments and all kinds of manner of qualities I have never been able to reconcile the three methods that I could use to compute depth:
and visual inspection with IGV.
The three methods will almost never produce the exact same values for depths, sometimes disagree enormously. Coping strategies include filtering your SAM file so that the tools do not have to apply additional corrections. Out of all methods IGV applies the most number of "tacit" assumptions that one may not even normally think about.
Example: Suppose a base that is "covered" by a deletion in the read. Should one increment the coverage for that coordinate?
The difference between the tools that calculate "read depth" or "coverage" are results of what is count and how is count.
Here's a little example and a comparison between
bedtools genomecov,samtools depthandpicard CollectHsMetricwith thePER_BASE_COVERAGEparameter.Let's assume these 4 reads:
F1 and R1 are a read pair. F2 and R2 are a read paire and marked as duplicates of F1 and R1.
bedtools genomecovtransfer the read coordinates to bed intervals and doesn't care about any relation information we have. It than just counts the overlap on each position. So the result will be a read depth of 2 for the positions 0-2 and 7-9 and a read depth of 4 for the positions 3-6.samtools depthtake care of the information that F2/R2 are duplicates. So it will ignor these reads when counting. This results in a read depth of 1 for the positions 0-2 and 7-9 and a read depth 2 for the position 3-6.picard CollectHsMetricsalso ignores duplicates when counting. The difference tosamtools depthis, that it doesn't count reads. It is counting fragments. This means if a read pair has an overlap at a given position, this is counted only once and not twice. This results in a coverage (I explicit avoid to call it "read depth") of 1 for the positions 0-9.Both -
samtools depthandpicard CollectHsMetrics- can also exclude bases or whole reads depending on their quality.The most accordance to igv you will get with
samtools depth, because igv also counts reads and not fragments and you can regulate which reads are shown and thus counted.fin swimmer
that is a nice summary that covers cases that haven't occurred to me. It is bioinformatics alright ... even simple concepts like read depth and coverage may have many competing definitions.
You are right in calling those 120x coverage bits as artifacts in fact when I filter the data by quality, they simply disappear; now I only have few spots with a coverage of 2 and one of 8000 (position 278016720).