
Hello everyone,
If you're interested in an easy way to create interactive Circos plots in R, and to integrate them in shiny applications or Rmarkdown documents, have a look at the BioCircos package!
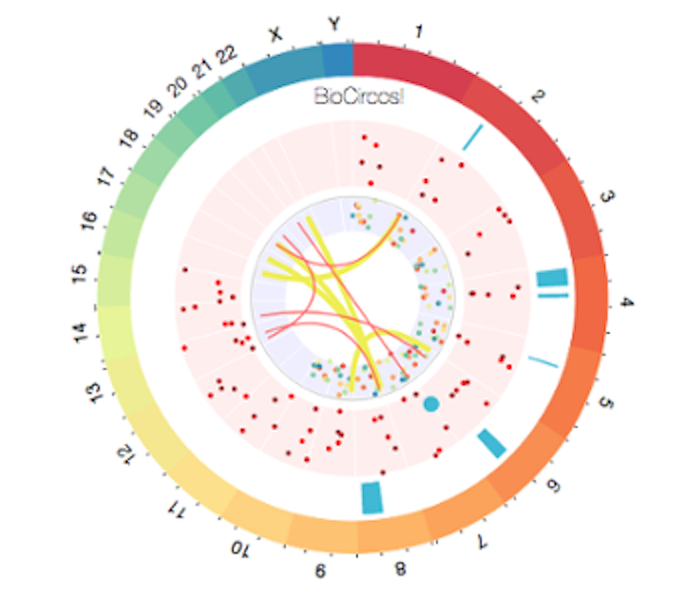
It's an htmlwidgets module wrapping the BioCircos.js library to create interactive (with nice custom tooltips and zooming features), multi-track (to integrate several layers of data such as variants, aberrations and fusions on the same figure), circular visualizations.
It is available on CRAN and the last dev version can be found on GitHub.
A simple way to start with the package and to see if it fits your needs is through the main vignette.
Of course if you would rather work directly in JavaScript the original BioCircos.js package will be more appropriate.
To report bugs, request features or for any question or remark regarding this package, please use the GitHub page.
Thank you and is there a zoom function (i.e to zoom in a particular region/chromosome)?
Yes, you can zoom in by scrolling with your mouse and slide to the target location. You can try it on the interactive examples displayed in the vignette.
[Update] Hi again, Just wanted to mention that the last update is also available on CRAN. Now other types of tracks are available, including interactive circular heatmaps and barplots! Feel free to check it out and to give feedback. Best regards.