Which program, tool, or strategy do you use to visualize genomic rearrangements?
In relation to my master thesis I'm working on tools to visualize fusion genes. In that regard I'm interested in any and all strategies and tools that exists for visualizing genomic rearrangements. I'll include the list I have so far below, and update the list when I get answers.
Programming packages:
- Circos: Perl package for circular plots, which are well suited for genomic rearrangements.
- J-Circos is a java application for doing interactive work with circos plots.
- ClicO FS: an interactive web-based service of Circos.
- rCircos: R package for circular plots.
- OmicCircos: R package for circular plots for omics data.
- ggbio: R package for visualizing biological data. Has a circular view similar to the previous packages.
- D3 chord diagrams (javascript) can be used to visualize genomic rearrangements. See this plot of migration flows as a similar example.
- chimeraviz: R package for chimeric RNA/fusion gene visualizations. (Disclaimer: I wrote this package.)
"Complete" tools:
- Genomatix Transcriptome Viewer: Gene Fusion analyses

- iFUSE: integrated fusion gene explorer

- FusionAnalyser: a new graphical, event-driven tool for fusion rearrangements discovery

- SOAPFuse includes the option to generate figures

- Gremlin

Gremlin is as far as I know not released anywhere. - Seqeyes: A flash tool for visualizing structural variations.

7 answers
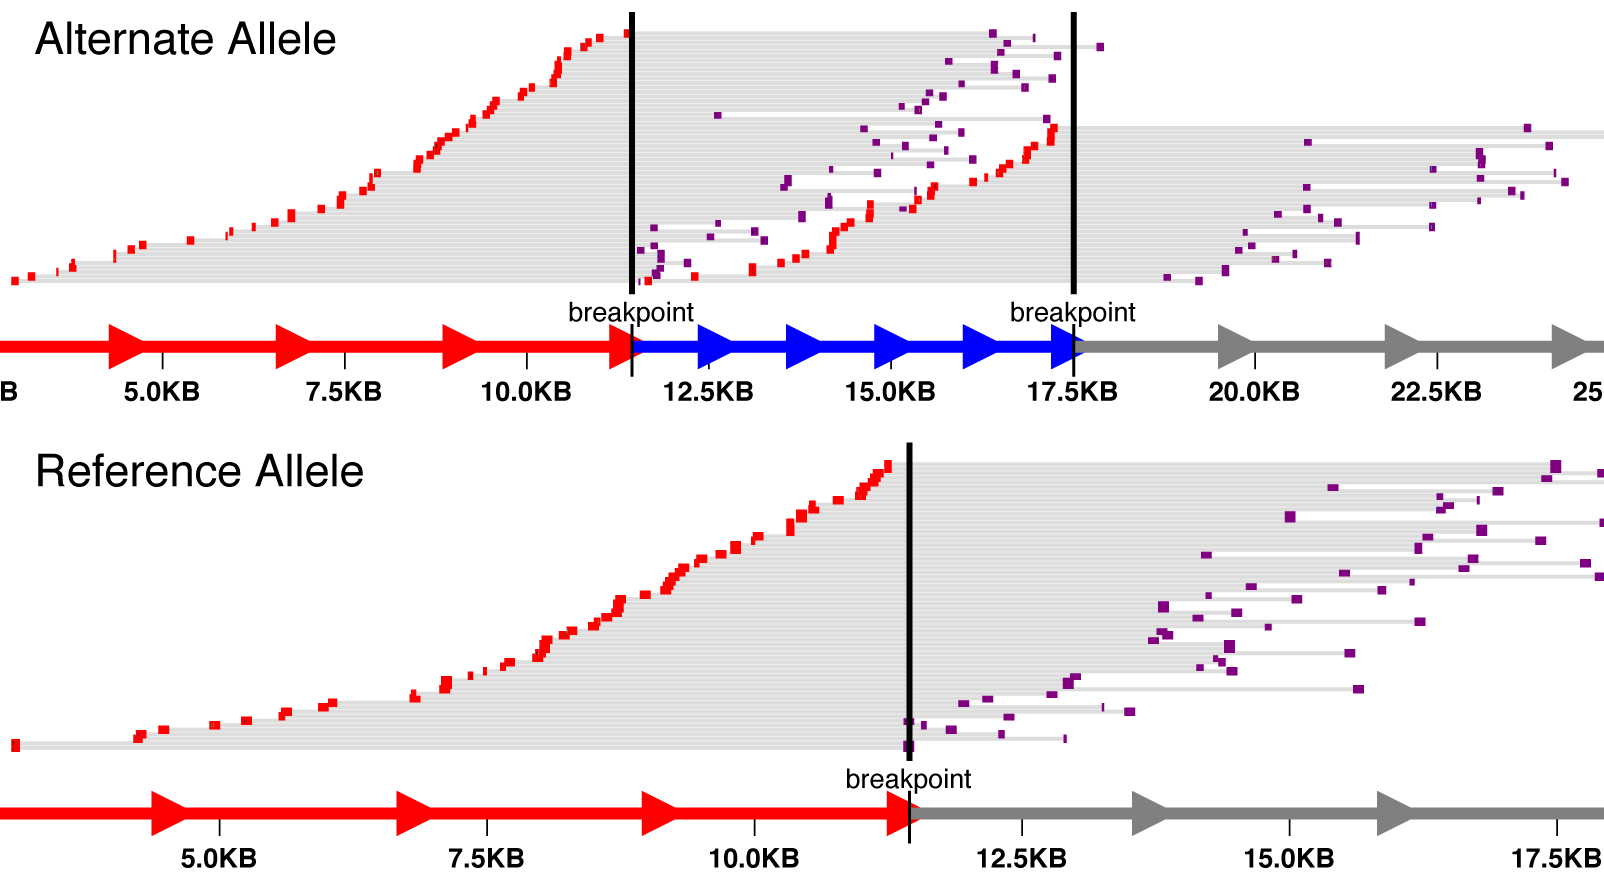
I have recently been very impressed with svviz (paper, git repo, project site, documentation).
svviz visualizes high-throughput sequencing data relevant to a structural variant. Only reads supporting the variant or the reference allele will be shown. svviz can operate in both an interactive web browser view to closely inspect individual variants, or in batch mode, allowing multiple variants (annotated in a VCF file) to be analyzed simultaneously.
More generically, a Sankey diagram could be used for a linear, horizontal or vertical presentation of rearrangements, as opposed to the Circos-based circular approaches.
One of my favourites and very easy to use:
ACT - Artemis Comparitive Tool
Citing the web:
ACT is a free tool for displaying pairwise comparisons between two or more DNA sequences. It can be used to identify and analyse regions of similarity and difference between genomes and to explore conservation of synteny, in the context of the entire sequences and their annotation.
ACT runs on UNIX, GNU/Linux, Macintosh and MS Windows systems. It can read complete EMBL and GENBANK entries or sequences in FASTA or raw format. Other sequence features can be in EMBL, GENBANK or GFF format.
You can also use circosJS: https://github.com/nicgirault/circosJS
i collect a large list of tools for visualization, some are specialized for SVs and re-arrangements. you can filter by tag (SV, CNV, comparative, etc) or scroll the whole list :) https://cmdcolin.github.io/awesome-genome-visualization/?latest=true
Log in to answer this question.
Just as a comment somewhat related to this: To the question A: I want to know what are some of the common problems facing a Bioinformatician? my answer is: Visualization!
Have you used, or know of, any of those tools to visualize circular RNAs? I am thinking shashimi plot for backspliced junction reads.