Is There Any Stand Alone Dot Plot Program?
9
8
Entering edit mode
13.5 years ago
Liuyunlong ▴ 130

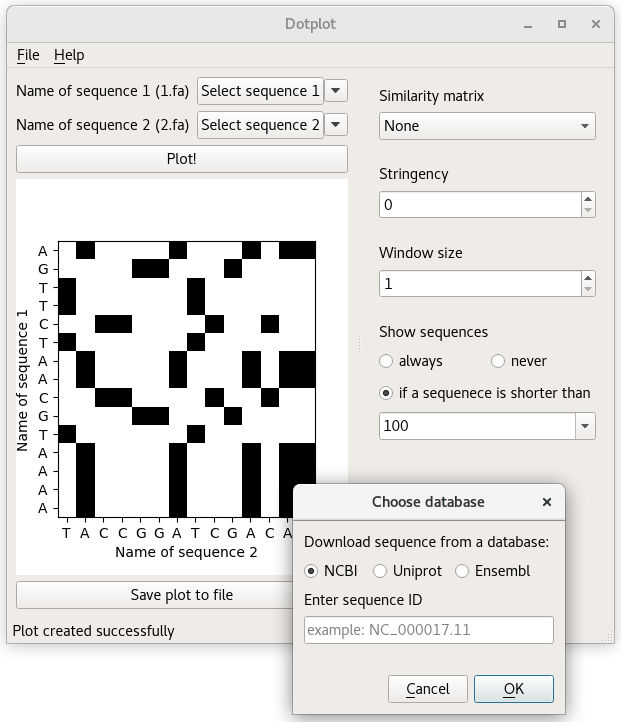
Is there any stand alone dot plot program which is like web-based in 'Plant Genome Duplication Database' or CoGE? Maybe dotter is a candidate,but I don't like its interface.

ps:It required whole genome pep blastp hit based plot,not sequence alignment based.

software sequence comparison • 18k views
ADD COMMENT
13
Entering edit mode
13.5 years ago

I use a python script to generate dot plot, for synteny purposes. It depends on a plotting library matplotlib. Incidentally, I am involved in the two projects you mentioned.

Usage:
blast_plot.py blast_file --qbed query.bed --sbed subject.bed

visualize the blast_file in a dotplot

Options:
  -h, --help   show this help message and exit
  --qbed=QBED  path to qbed
  --sbed=SBED  path to sbed
  --synteny    run a fast synteny scan and display synteny blocks

blast_file is a BLAST tabular output (-m 8 in BLAST or -outfmt 6 in BLAST+). The .bed file has four columns.

chromosome_id    start    stop    gene_name

The gene names in query.bed has to match the names used in the first column in blast_file; names in subject.bed has to match names in the second column in blast_file.

Optionally, flag --synteny will highlight all the syntenic blocks in this dot plot.

ADD COMMENT
0
Entering edit mode

Orz,It's very very helpful.And if I want to show MCscan pairwise alignment result rather than a fast synteny scan,what could I do? Or just to transform the MCscan result to blast m8 like format ,is also can meet my job's requirement

ADD REPLY
0
Entering edit mode

It's very very helpful.And if I want to show MCscan pairwise alignment result rather than a fast synteny scan,what could I do? Or just to transform the MCscan result to blast m8 like format ,also can meet my job's requirement,thanks very much.谢谢

ADD REPLY
0
Entering edit mode

Readme of quota-alignment make me understand more clearly:)

ADD REPLY
5
Entering edit mode
13.5 years ago
Neilfws 49k

The MUMmer package can generate a variety of genome-scale alignments (including translated nucleic acid sequence, using promer). It also has several plotting options: see mummerplot on the examples page for a dotplot-like example.

ADD COMMENT
3
Entering edit mode
ADD COMMENT
2
Entering edit mode
13.5 years ago

You may try polydot or dotpath from EMBOSS suite.

ADD COMMENT
1
Entering edit mode
13.5 years ago

googling for 'dotplot' returns many command-line programs: e.g: http://emboss.sourceforge.net/apps/release/5.0/emboss/apps

ADD COMMENT
0
Entering edit mode

I think most of the EMBOSS apps (dotmatcher, dotpath, dottup) only plot 2 sequences against each other.

ADD REPLY
1
Entering edit mode
ADD COMMENT
0
Entering edit mode
6.0 years ago

We wrote this small python script: https://pypi.python.org/pypi/dotplot/ which provides both CLI and GUI, although it is sequence based:

GUI

ADD COMMENT
0
Entering edit mode
6.0 years ago
toheitka ▴ 230

Maybe you'll enjoy FlexiDot: It is well documented, implemented in Python and controlled with the commandline. It allows all-against-all, pairwise and self dotplots, and comes with many features, such as

  • Combination of structural annotations (gff3) with dotplots, or
  • LCS similarity shading and custom matrix dotplots

Code on github: http://github.com/molbio-dresden/flexidot

Publication: http://doi.org/10.1093/bioinformatics/bty395

FlexiDot example all-against-all dotplot

ADD COMMENT

Login before adding your answer.

Traffic: 2557 users visited in the last hour
Help About
FAQ
Access RSS
API
Stats

Use of this site constitutes acceptance of our User Agreement and Privacy Policy.

Powered by the version 2.3.6