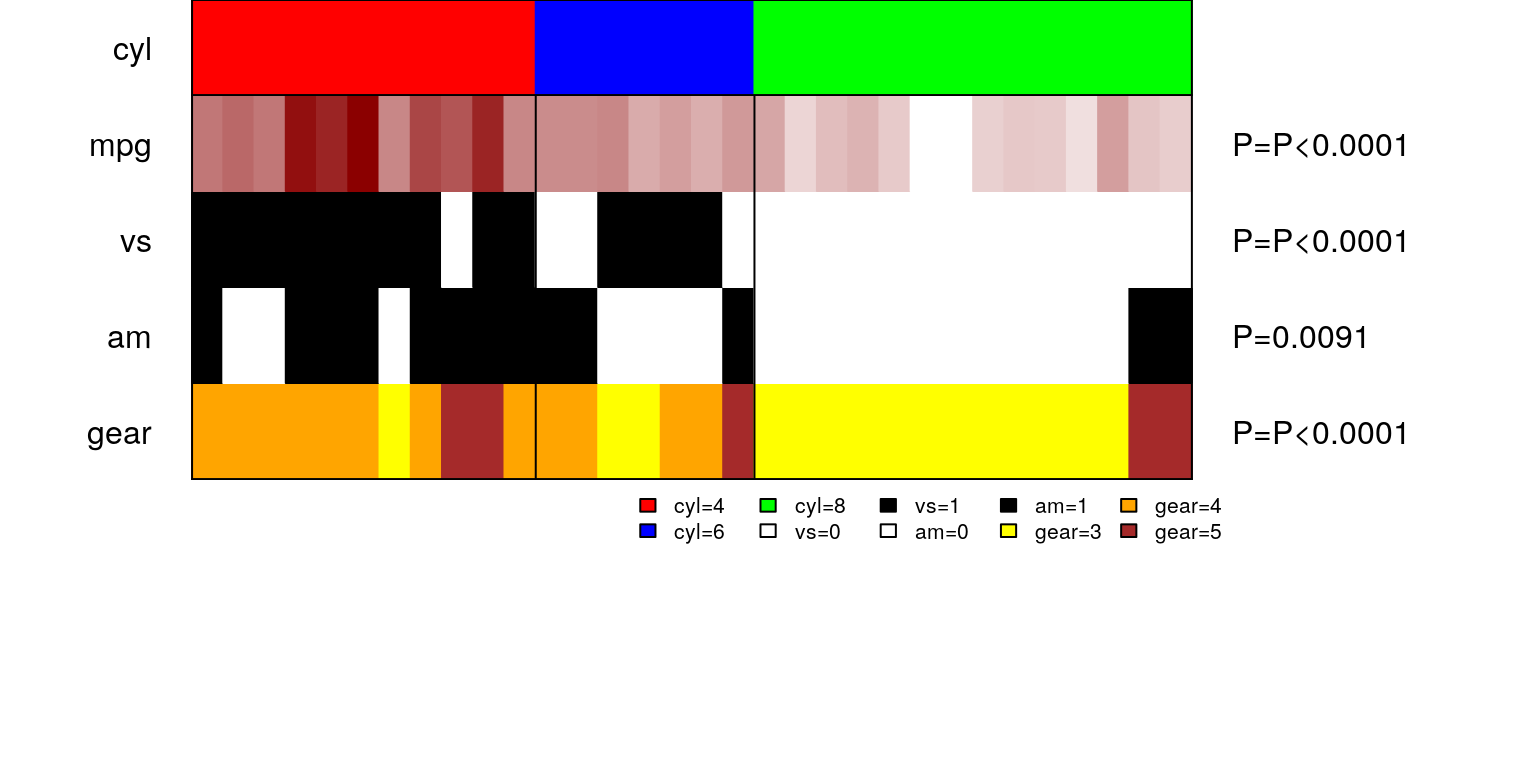
looks great, thanks Chris !
• 1 views
•
link
Dear all,
please could you recommend any packages in R (or any other language) that are specialized on displaying various mutation profiles (eg heatmaps of mutations vs samples, frequency of mutations etc ;) thank you !
-- bogdan
Hi, I created a package panelmap to visualize clustered categorical/continuous `omics data types including mutation data. In its essence, it is a heatmap and I am calling it panelmap!
If you have frequencies of mutations, then that is continuous data, and panelmap can plot that for each sample.
panelmap's appearance can be customized and each plot includes a legend for all the variables used. See an example on mtcars Hope it helps with your visualization! panelmap on mtcars dataset
Log in to answer this question.