How to plot B-allele frequency and Log R ratio using R
2
0
Entering edit mode
8.0 years ago
Raj • 0

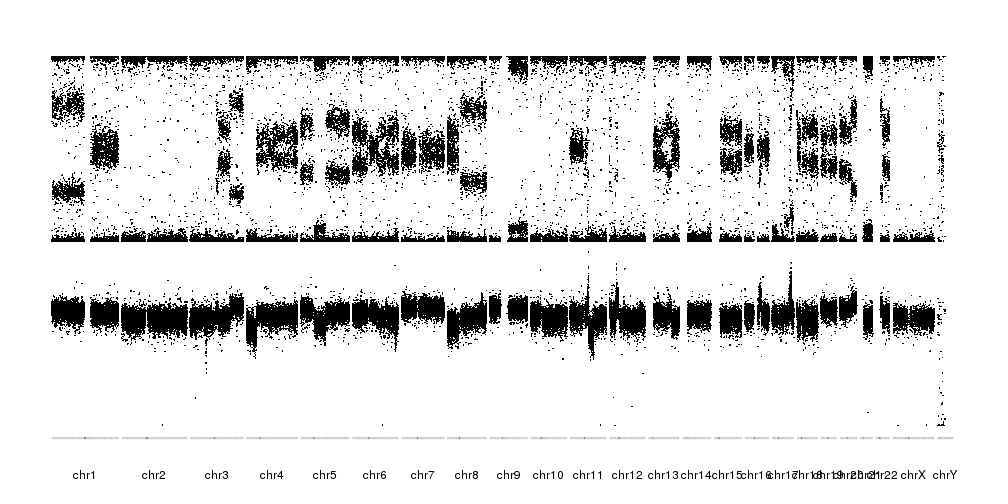
Hi i am new to R as well as microarray data analysis. I processed illumina array data using genomestudio and got the B-allele frequency and Log R ratio. Now i am trying to plot these values for all the chromosomes in a single plot using R. But i am unable to do it. Please if you guys have some suggestion then let me know. Thanks.

R • 7.4k views
ADD COMMENT
0
Entering edit mode

Thanks for the information

ADD REPLY
2
Entering edit mode
8.0 years ago
Michael 54k

See Drawing Chromosome Ideograms With Data one of the methods listed there should work for you.

ADD COMMENT
2
Entering edit mode
6.4 years ago
bernatgel ★ 3.4k

To plot data along the genome you can use karyoploteR. It's in Bioconductor (so you can install it with BiocManager::install(karyoploteR) and can plot almost anything on almost any genome.

There's a tutorial and examples page that contains a specific example on how to plot BAF and LRR values from SNP array that produces a plot like this:

enter image description here

You can customize the image in many ways to adjust it to your needs.

ADD COMMENT

Login before adding your answer.

Traffic: 1591 users visited in the last hour
Help About
FAQ
Access RSS
API
Stats

Use of this site constitutes acceptance of our User Agreement and Privacy Policy.

Powered by the version 2.3.6