Thanks. Sorry I didn't make it clearer. This is what I meant to look like. http://realtamortgage.com/gfx/colors.gif

• 0 views
•
link
Hi,
Is there an easy way to display a sequence like "ATCC" as "red blue green green" colors on a figure, when red = A, blue = T, and green = C? I am thinking something like a heatmap in R if I can assign color to discrete values. Thanks.
Ugly & quick HTML hack:
transform it to HTML, e.g. through sed:
sed 's/[ACTG]/&<\/span>/gi' seq.color > seq.html
Attach a stylesheet to it, e.g.:
<head>
<style TYPE="text/css">
  .A {
     color: red;
     background: red;
     font-family: monospace;
     font-size: 40px;
  }
  .C {
     color: green;
     background: green;
     font-family: monospace;
     font-size: 40px;
  }
  .G {
     color: orange;
     background: orange;
     font-family: monospace;
     font-size: 40px;
  }
  .T {
     color: blue;
     background: blue;
     font-family: monospace;
     font-size: 40px;
  }
</style>
</head>
The result file should look like:
<head>
<style TYPE="text/css">
  .A {
     color: red;
     background: red;
     font-family: monospace;
     font-size: 40px;
  }
  .C {
     color: green;
     background: green;
     font-family: monospace;
     font-size: 40px;
  }
  .G {
     color: orange;
     background: orange;
     font-family: monospace;
     font-size: 40px;
  }
  .T {
     color: blue;
     background: blue;
     font-family: monospace;
     font-size: 40px;
  }
</style>
</head>

<span class="A">A</span><span class="G">G</span><span class="G">G</span><span class="C">C</span><span class="T">T</span><span class="T">T</span><span class="T">T</span><span class="A">A</span><span class="G">G</span><span class="t">t</span><span class="g">g</span><span class="c">c</span><span class="A">a</span>
Open in a web browser
Thanks. Sorry I didn't make it clearer. This is what I meant to look like. http://realtamortgage.com/gfx/colors.gif
@John: ah, ok! well, you can simply add a background of the same color. I'll update the examples.
Thanks Giovanni!
Sorry, I forgot that you should also use a Monospace font.
Well... I'm not sure what you mean by "on a figure", but in the past, I've done this with HTML like Giovanni said or (slightly dumber) with a script that puts a <font color=\"#FF0000\"></font> around all A's or whatever.
In R, you can use the text() command to put text on a plot or just use pch='A' and color='red' to make points on a plot red A's, for example.
seq<-"ATCGTACG"
seqlist<-strsplit(seq,"")
cols<-c('red','blue','green','purple')
plot(1:length(seqlist[[1]]),rep(1,times=length(seqlist[[1]])),pch=seqlist[[1]],col=cols[factor(seqlist[[1]])])
This would take some fiddling for a longer sequence, but you get the idea.
EDIT: after reading your comment above, it's actually easier.
seq<-"ATCGTACG"
seqlist<-strsplit(seq,"")
cols<-c('red','blue','green','purple')
image(matrix(as.numeric(factor(seqlist[[1]]))),col=cols)
Thanks. I will try it.
A quick hack (not fully tested, but you'll get the idea): the following C program will generate a postscript file with the colored rectangles:
#include <stdio.h>
#include <stdlib.h>
#include <math.h>
#include <string.h>
#include <ctype.h>

int main(int argc,char** argv)
    {
    int i,j,k,n;
    double SIZE=500.0;
    double side=0;
    int c;
    int len=0;
    char* s=malloc(sizeof(char));

    if(s==NULL) return EXIT_FAILURE;
    while((c=fgetc(stdin))!=EOF)
        {
        if(isspace(c)) continue;
        s=realloc(s,sizeof(char)*(len+2));
        if(s==NULL)
            {
            fprintf(stderr,"Out of memory\n");
            return EXIT_FAILURE;
            }
        s[len++]=c;
        }
    s[len]=0;
    if(len==0) return EXIT_FAILURE;
    n=ceil(sqrt(len));
    side=SIZE/n;
    k=0;
    printf("%%!PS\n");
    printf("/dside 100 def\n");
    printf("/box { 2 dict begin /y exch def /x exch def "
        "newpath "
        "y dside mul x dside mul moveto "
        "dside 0 rlineto "
        "0 dside rlineto "
        "dside -1 mul 0 rlineto "
        "0 dside -1 mul rlineto "
        "closepath "
        "fill "
        "  end} bind def\n");
    printf("/red   {  1 0 0 setrgbcolor  box } bind def\n");
    printf("/green {  0 1 0 setrgbcolor  box } bind def\n");
    printf("/blue  {  0 0 1 setrgbcolor  box } bind def\n");
    printf("/yellow  {  1 0 1 setrgbcolor  box } bind def\n");
    printf("/black {  0 0 0 setrgbcolor  box } bind def\n");
    for(i=0;i< n && k<len;i++)
        {
        for(j=0;j<n && k<len;++j)
            {
            printf("%d %d",i,j);
            switch(toupper(s[k++]))
                {
                case 'A': fputs(" red\n",stdout); break;
                case 'T': fputs(" green\n",stdout); break;
                case 'C': fputs(" yellow\n",stdout); break;
                case 'G': fputs(" blue\n",stdout); break;
                default: fputs(" black\n",stdout); break;
                }
            }
        }
    printf("showpage\n");
    return 0;
    }
Compilation:
gcc -o biostar12763 -Wall source.c -lm
Execution:
echo "ATAGCTAGCATCAGTCTAGCTTAGCTAGCGCNNACTAGCT" | ./biostar12763   > file.ps
ghostview file.ps ## or evince file.ps or... etc...
Thanks. A little different than what I want.
I don't know how to make this with R, but I think you can open the sequences with mega or clustalX, in which the nucleotides are colored, and then get a screenshot.
Thanks for the suggestion. I am trying to make this into a pipeline. Fewer separate programs would be better for me.
This is pretty hacktastic, but I don't know a better way
library(ggplot2)
dna <- "ATAGCATCGACTAG"
bases <- unlist(strsplit(dna, ""))
col_scheme <- c("red", "green", "yellow", "blue")
names(col_scheme) <- c("A", "T" ,"C", "G")
p <- qplot(1:length(bases), 1, fill=col_scheme[bases])
p + geom_tile() + scale_fill_identity()
You should really think about if you want to use (simple) red and green in the same plot - ~8% of males can't tell the difference. Is there a good reason for colouring these bases but ignoring those people?
whoops, hadn't noticed mmarchin's answer which is more or less the same as this, but with base graphics and is less hack-tastic :)
Dear,
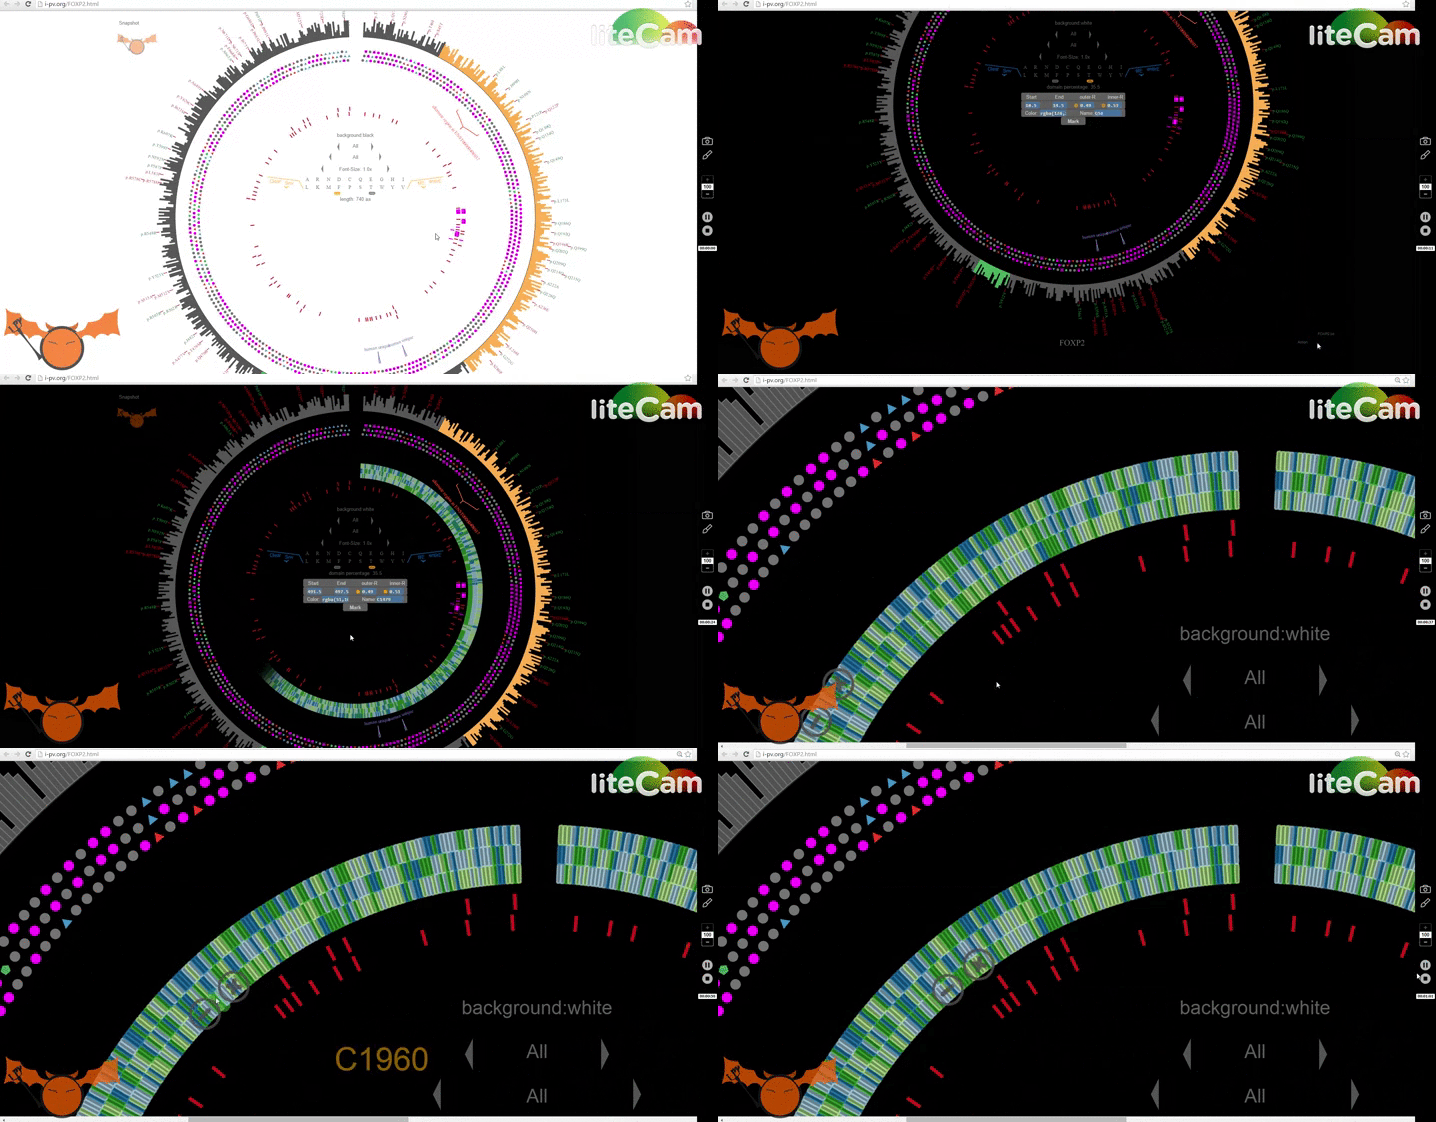
If you are working on proteins, you can use I-PV just as shown in the link here.
You will need to make your sequence file in a txt editor, ms excel etc. Here is an example.
You can visit the main website for more information.
I hope this helps,
Good luck with your research,
Log in to answer this question.
what do you mean "On a figure" ?
What I meant was to display ATCC as colored squares in a row. Sort of like this figure. http://realtamortgage.com/gfx/colors.gif