I'm looking for a free software tool, R-package or Matlab script to create interactive 3D scatter plots of biological data (gene and protein expression data, or metabolite abundances), which allows the users to add biological annotations to the data points (representing biomolecules) and display them when a user hovers the mouse over them. I found many scatter plot tools so far, but adding interactive annotations does not seem to be supported in most cases.
Many thanks for your help.
5 answers
You can try the R-package vrmlgen which provides annotated 3D scatter plots in VRML and LiveGraphics3D format (see also page 7 of the documentation). Works also with large numbers of data points.
If you're not stuck with R or Matlab, you can do interactive 3D plots with three.js and WebGL-capable web browsers. Examples are available here - specifically, the example of interest will likely be the interactive particles demo, which can be modified for your case to display a matrix of interactive points in 3D space.
For annotations, my own explorations would suggest that you create text elements out of SVG, render them to a canvas with canvg and then programmatically set as a texture map for another particle in 3D space when a relevant interaction event (i.e., a mouseover event) takes place. You might show an experiment name, cell type, etc. when mousing over a point in space.
I'm still working out how to render these into vector outputs for publication-quality figures. These use the WebGL rendering capabilities built into Safari, Chrome and Firefox browsers, and three.js's SVGRenderer component is simply not as capable as the WebGL engine. Most likely, in order to make a vector-quality figure I will pass parameters in an Ajax request to an R instance running rgl in the back-end, which spits a PDF file back at the client. So if you need to make figures from this approach, I suspect that this is likely going to be a bit more work.
However, if you just want to render an interactive visualization, you could pass a matrix file URL to a three.js client in a GET request, and then the client does all the work of showing an animation. You can also attach an orbit-control handler to deal with click, drag and zoom events, to change the camera angle and depth.
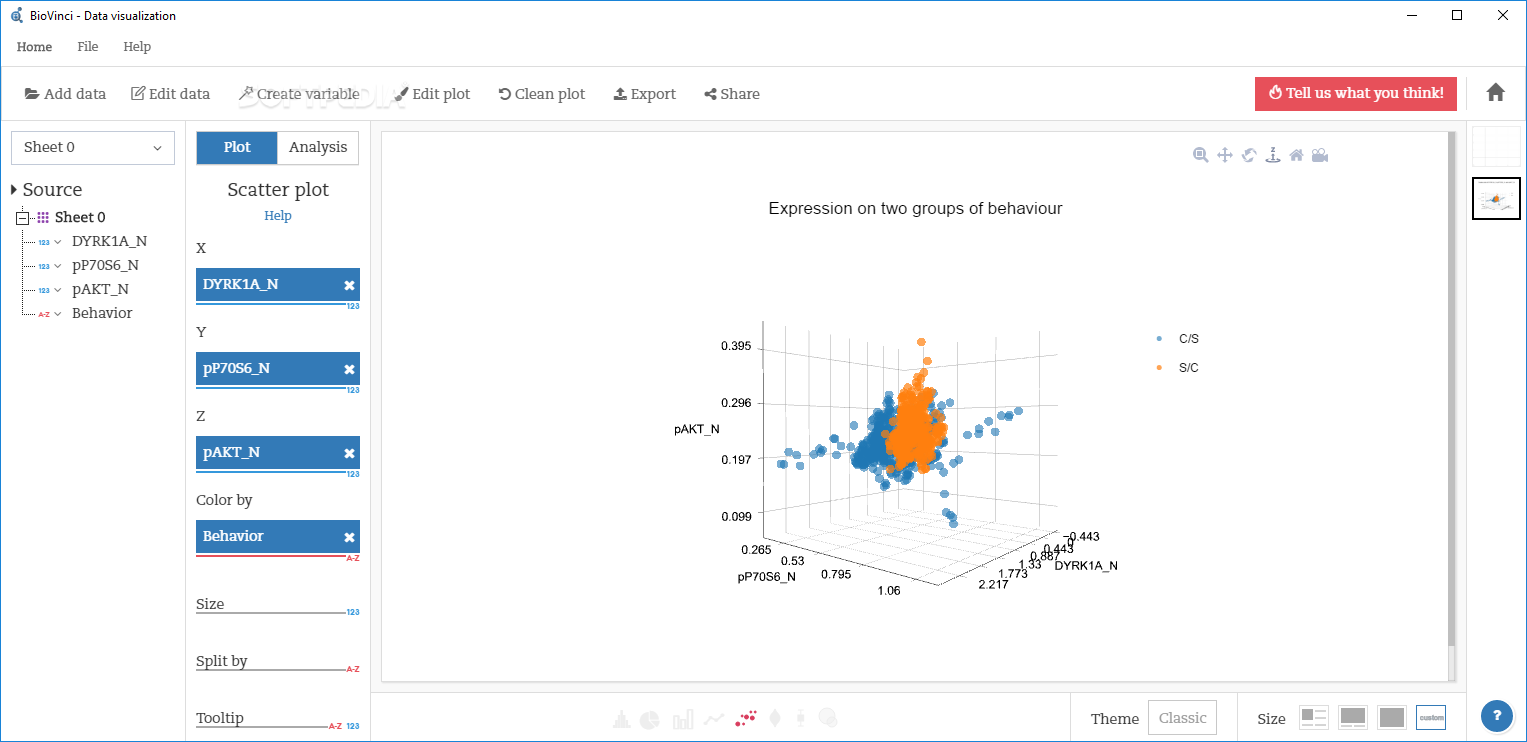
If you're still looking for the one, I'd suggest BioVinci. I've tried the interactive 3D scatter plot over there and it works fine for me. You can download it here at https://vinci.bioturing.com/ . It's got a tooltip function that lets you see the information when you hover your mouse.
Google charts provide you with interactive and complex plots.
It is easy to implement with simple pre-defined libraries.
Example: https://developers.google.com/chart/interactive/docs/gallery/scatterchart
Log in to answer this question.