Thanks. I will give it a shot and will keep you posted on how things turned out.
• 1 views
•
link
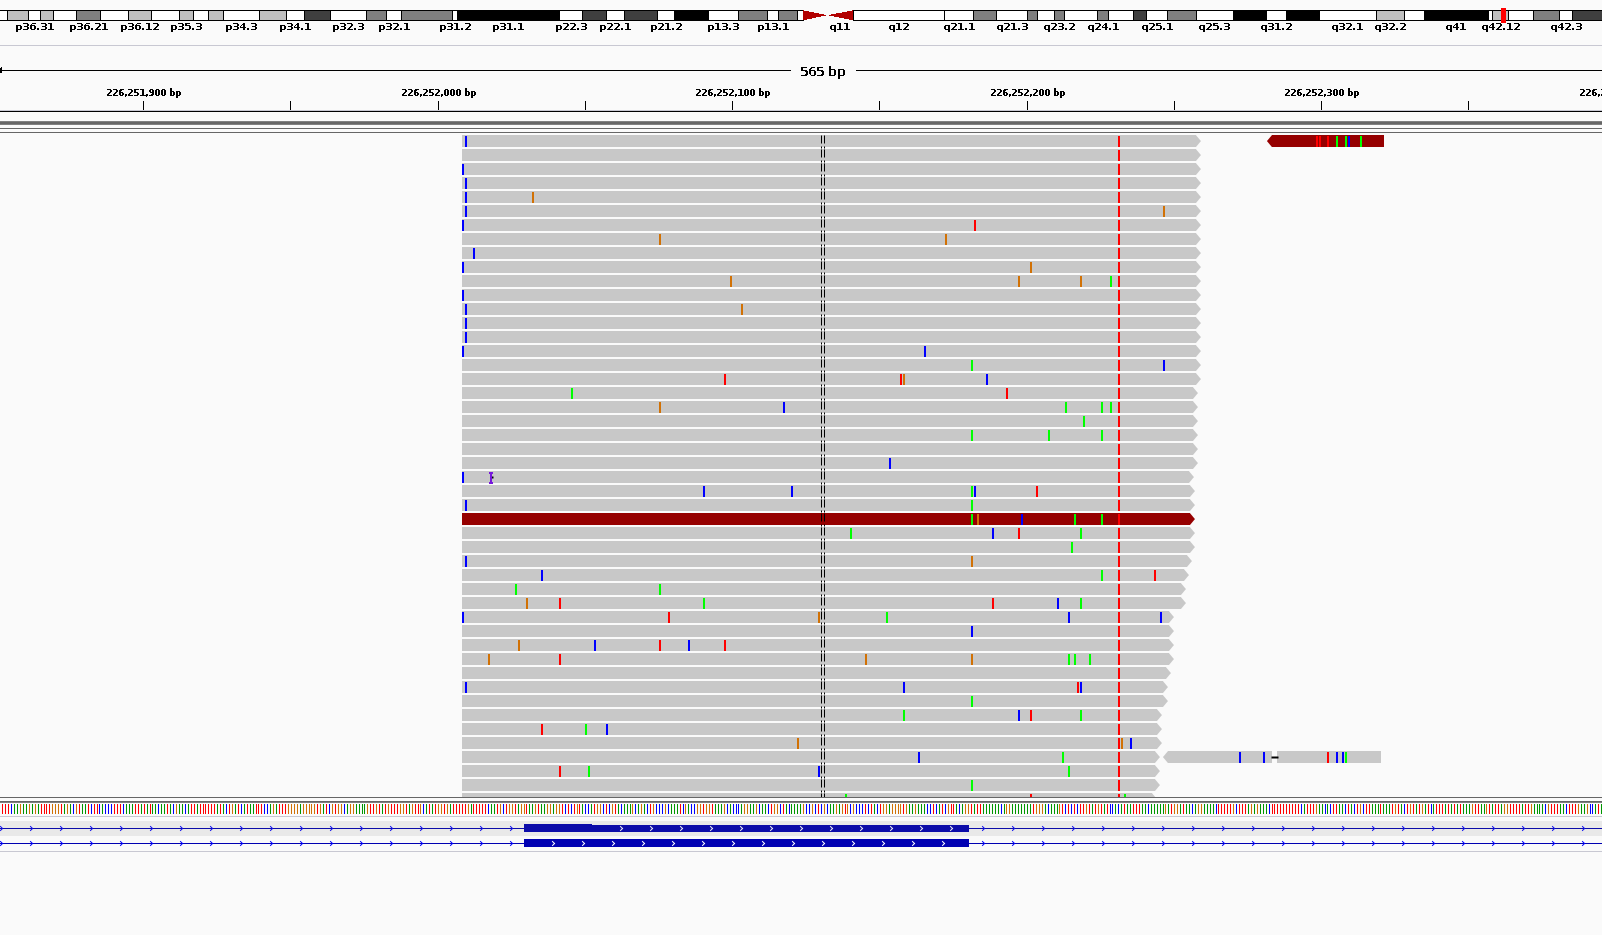
I am trying to hunt for very low frequency substitutions in MiSeq ultra-deep (targeted amplicon) sequencing. The problem is the very vast amount of noises in high coverages. As you can see in the picture below, there are a large number of (partly randomly) scattered pseudo substitutions all around my amplicons. I don't have this problem when I am looking at WES data. I was told that this is somehow normal to see the noise. But the problem is how to distinguish between these noises and real verly low frequency substitutions? Some of them have frequencies near zero and are easy to filter out but what about those with frequencies close to 1%? Also, to get a better estimate of real allele frequencies, I need to consider the amount of noise in calculating the frequencies. For example, if I find a real susbstitution with allele frequency close to 1%, how would I know how much of this 1% is real and how much of it is noise?
http://www.bioconductor.org/packages/release/bioc/html/deepSNV.html
"This package provides provides a quantitative variant callers for detecting subclonal mutations in ultra-deep (>=100x coverage) sequencing experiments. The deepSNV algorithm is used for a comparative setup with a control experiment of the same loci and uses a beta-binomial model and a likelihood ratio test to discriminate sequencing errors and subclonal SNVs. The new shearwater algorithm (beta) computes a Bayes classifier based on a beta- binomial model for variant calling with multiple samples for precisely estimating model parameters such as local error rates and dispersion and prior knowledge, e.g. from variation data bases such as COSMIC."
Great, your situation seems pretty much ideal. For your purposes, it probably does not matter that you have multiple phenotypes, unless you expected the individuals with a particular phenotype to all have the same low-level mutation.
I would use samtools mpileup to create a multisample pileup. Then for each each position and each sample, I would find the distribution of nucleotides. Ex. sample1_position1 = [ A = 9,657; G = 107; C = 12; T = 13 ]; sample2_position1 = ... You can then find the mean and standard deviation of 'A,G,T,C' calls at every position. Lastly, if a particular sample has a particular nucleotide that is > X standard deviations above the mean, output that information of a summary file.
This is a pretty rough outline, but it should lead you down the right path.
Thanks. I will give it a shot and will keep you posted on how things turned out.
Great info, thanks!
Just note that NGS data are measured in counts and so are not normally distributed, particularly at low counts. A simple mean/sd is perhaps not the best statistical model, though the idea of modeling the noise makes perfect sense.
Log in to answer this question.
First of all make sure you trim your data for quality, especially for MiSeq. There are tools out there, I myself use a script integrated in the PoPoolation toolkit. Second, I would suggest only considering SNPs that are present at least 2-3 times, and discard all singletons.
Thanks Adrian but the question is more about those that already have passed the Q threshold and exist more than a dozen times in coverages around 10,000 (e.g. 24 out of 12,000).
Do you have multiple samples or are these single samples?
Artifacts are likely to be recurrent among multiple samples so if you have multiple samples the best method would be to model the error rates for each SNV at every position in the targeted region and then find SNVs which are outliers of that distribution.
If you have single samples, this problem is more difficult.
There are several samples (more than a hundred actually) with similar phenotypes but from different patients. So it's I would say a combination of both situations.