Hi everyone,
About four months ago, I posted here about Jetomics, our private, local desktop platform for analyzing transcriptomics data. We received some incredibly constructive feedback regarding our architecture, our trial model, and academic accessibility.
I wanted to share a major update (v2.0.0) that directly addresses those discussions, along with a new set of features we've just rolled out.
Desktop Spatial Transcriptomics (Xenium Support)
We have introduced a Spatial Transcriptomics Suite that currently supports Xenium datasets (with Visium support expanding). Because Jetomics runs entirely locally on standard desktop hardware (no dedicated GPU required), we had to design an optimized backend to make it work smoothly on a standard laptop:
- Out Of Core Image Rendering: A dual-engine tile server built on pyvips and zarr/tifffile that lazy-loads massive OME-TIFF morphology images safely.
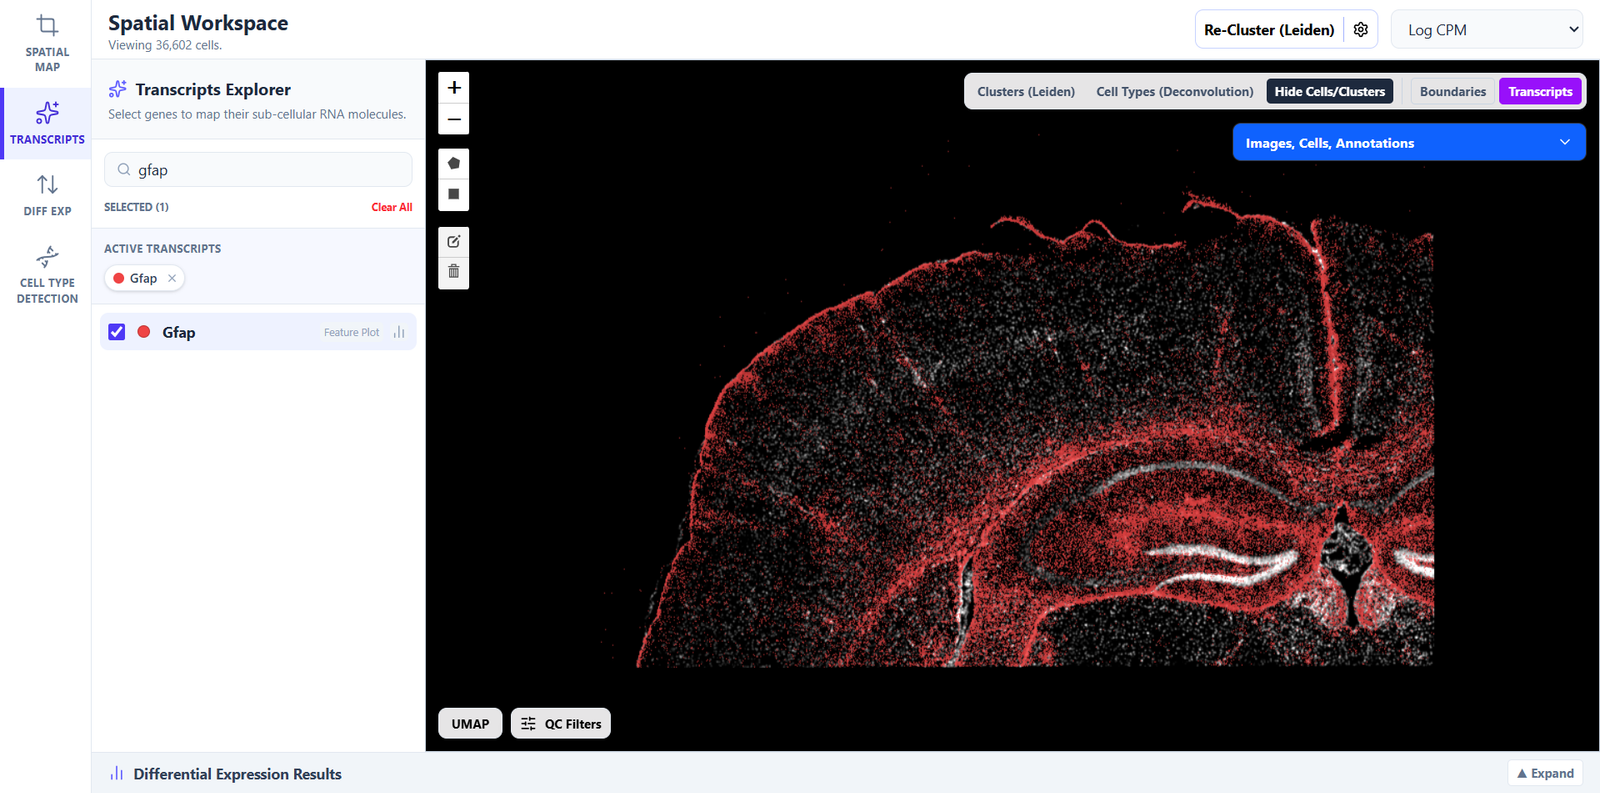
- Database-backed Transcripts: We use DuckDB to query and partition sub-cellular transcript coordinates on-the-fly, paired with Datashader for real-time density rendering of spots.
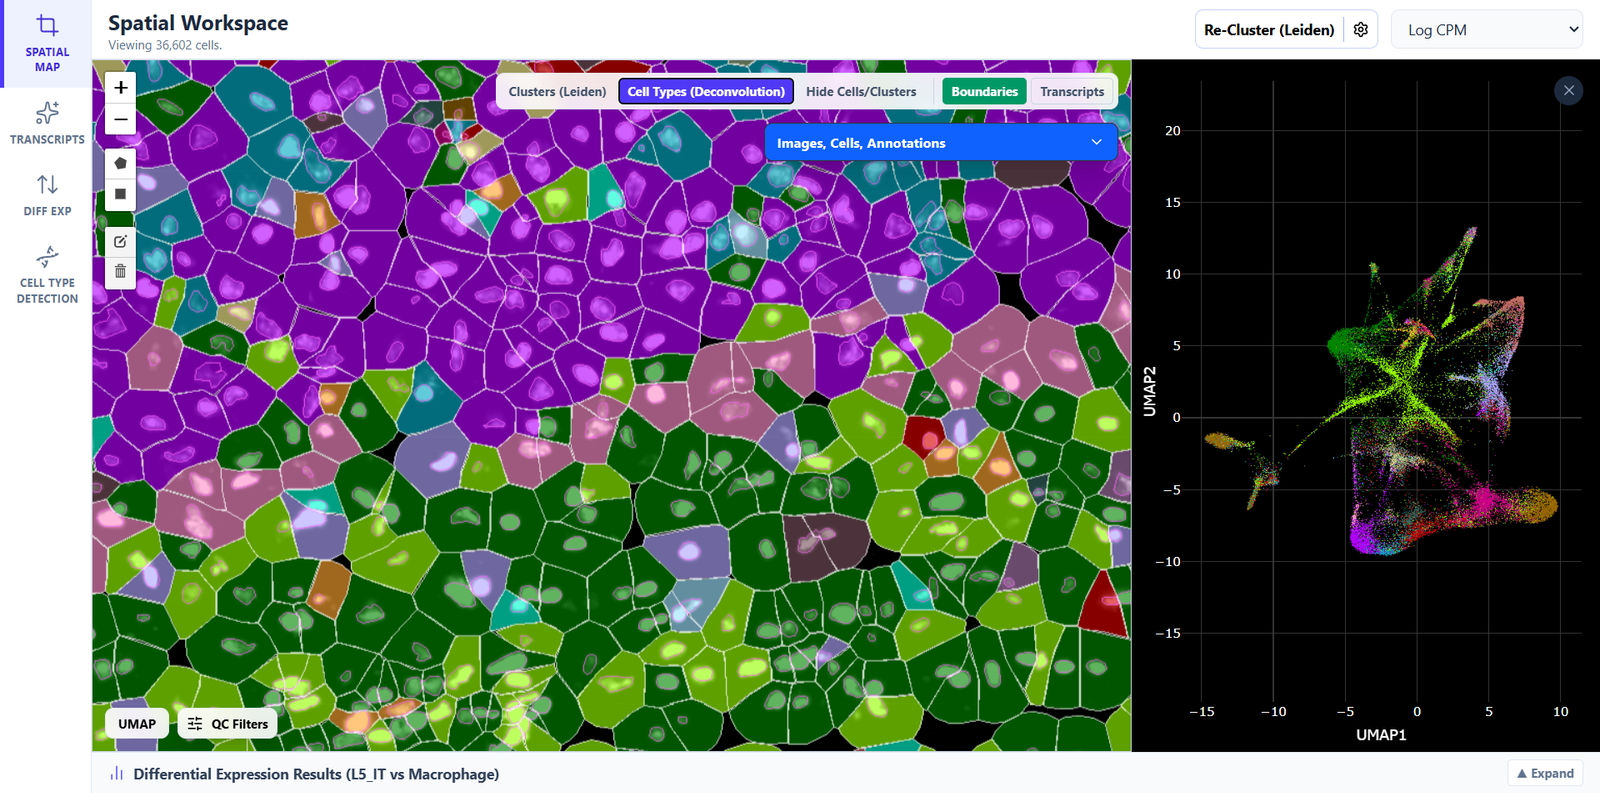
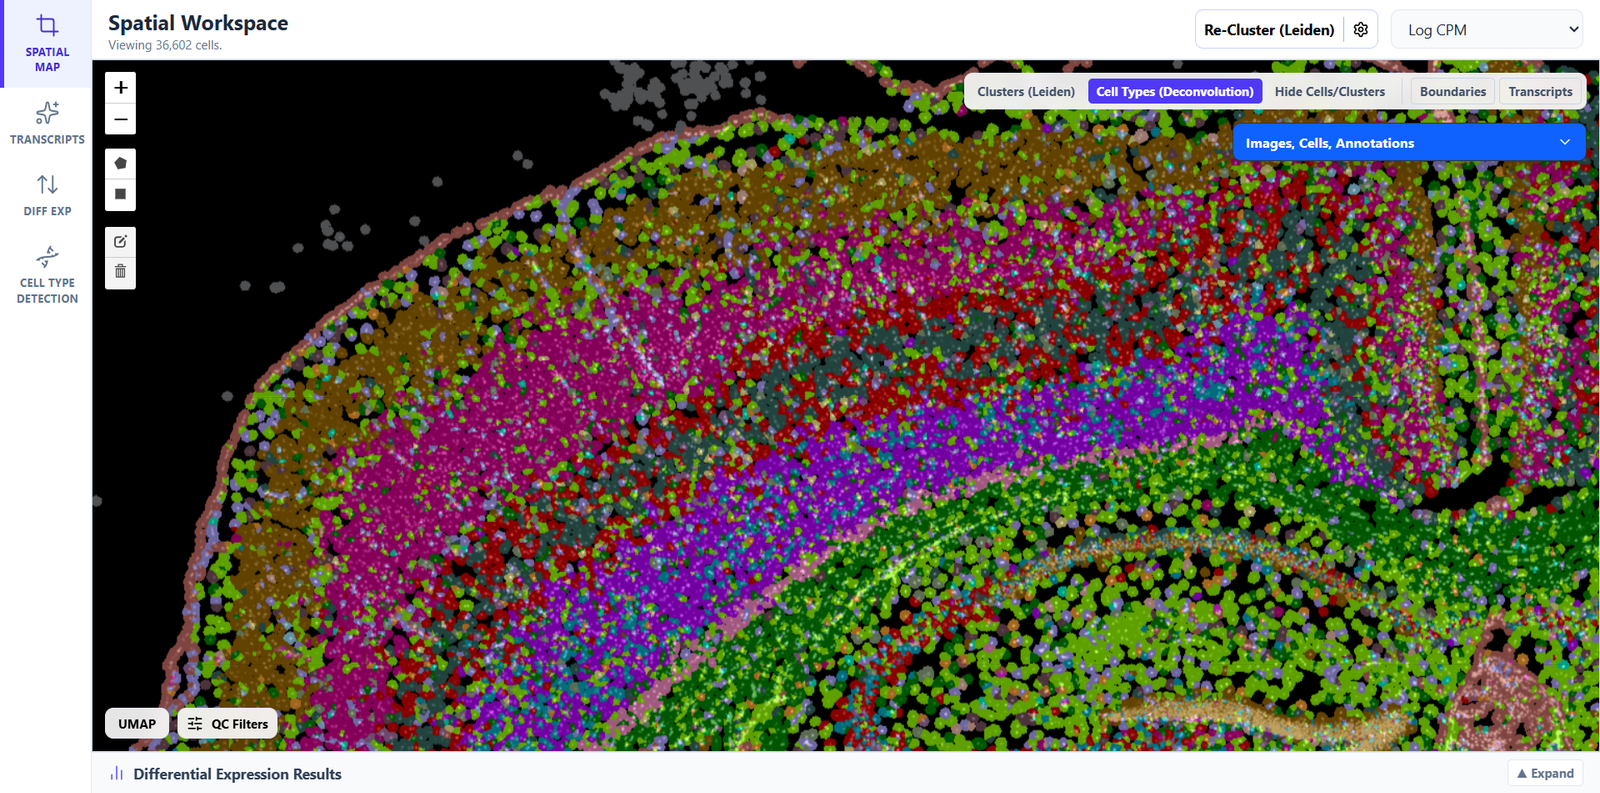
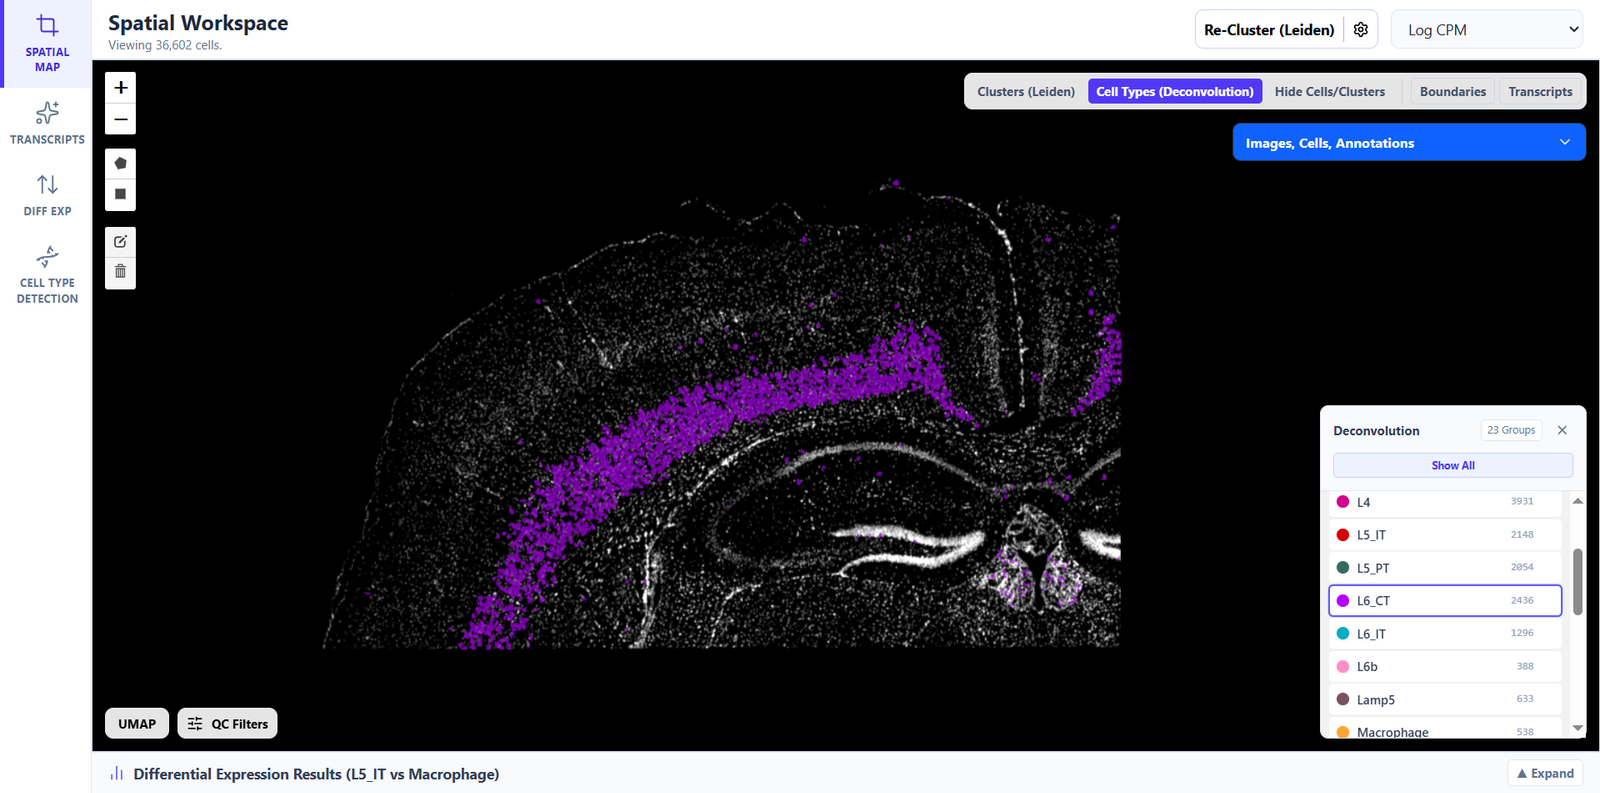
- Interactive Downstream Analysis: Includes Leiden clustering, UMAP coordinates generation, cell-type annotation (using local Seurat/spacexr for RCTD), and responsive Plotly-based violin plots.
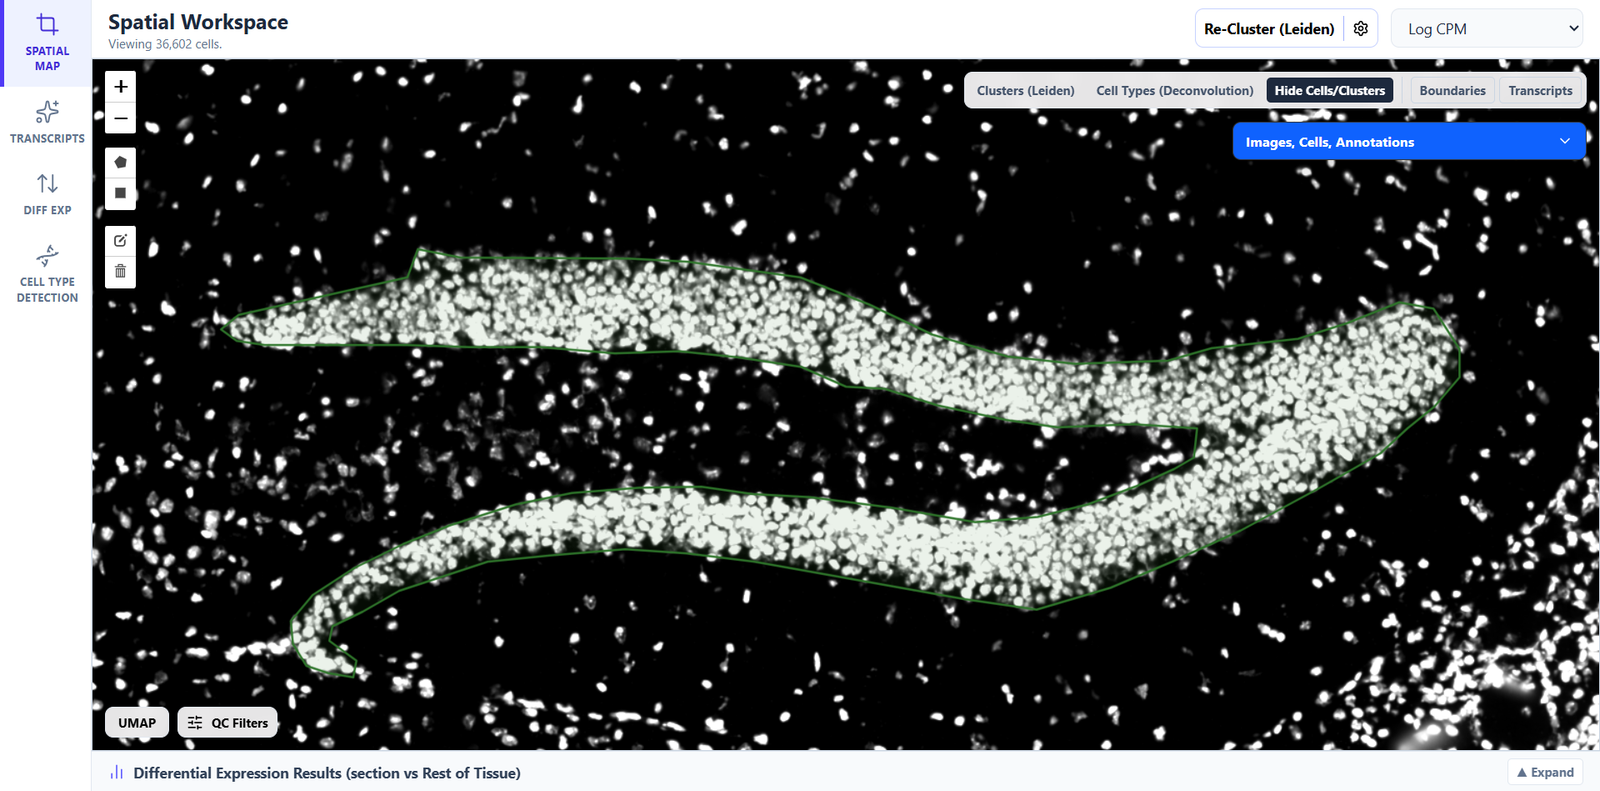
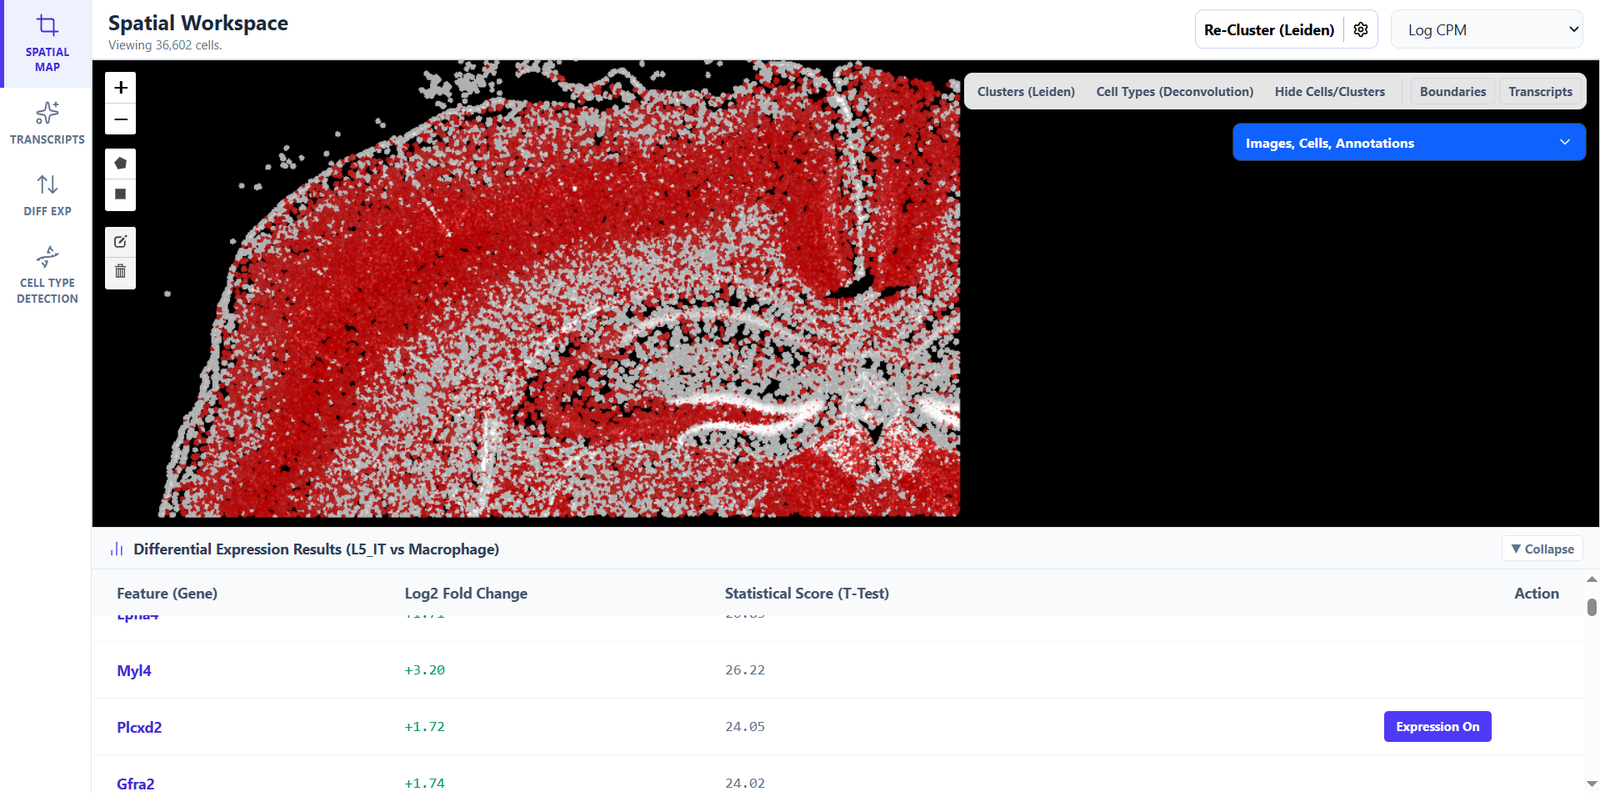
- On-the-Fly Differential Expression: Draw custom polygons (ROIs) on the map, and run instant, memory-safe Welch's T-Test calculations paired with Benjamini-Hochberg FDR corrections to locate marker genes in real time.
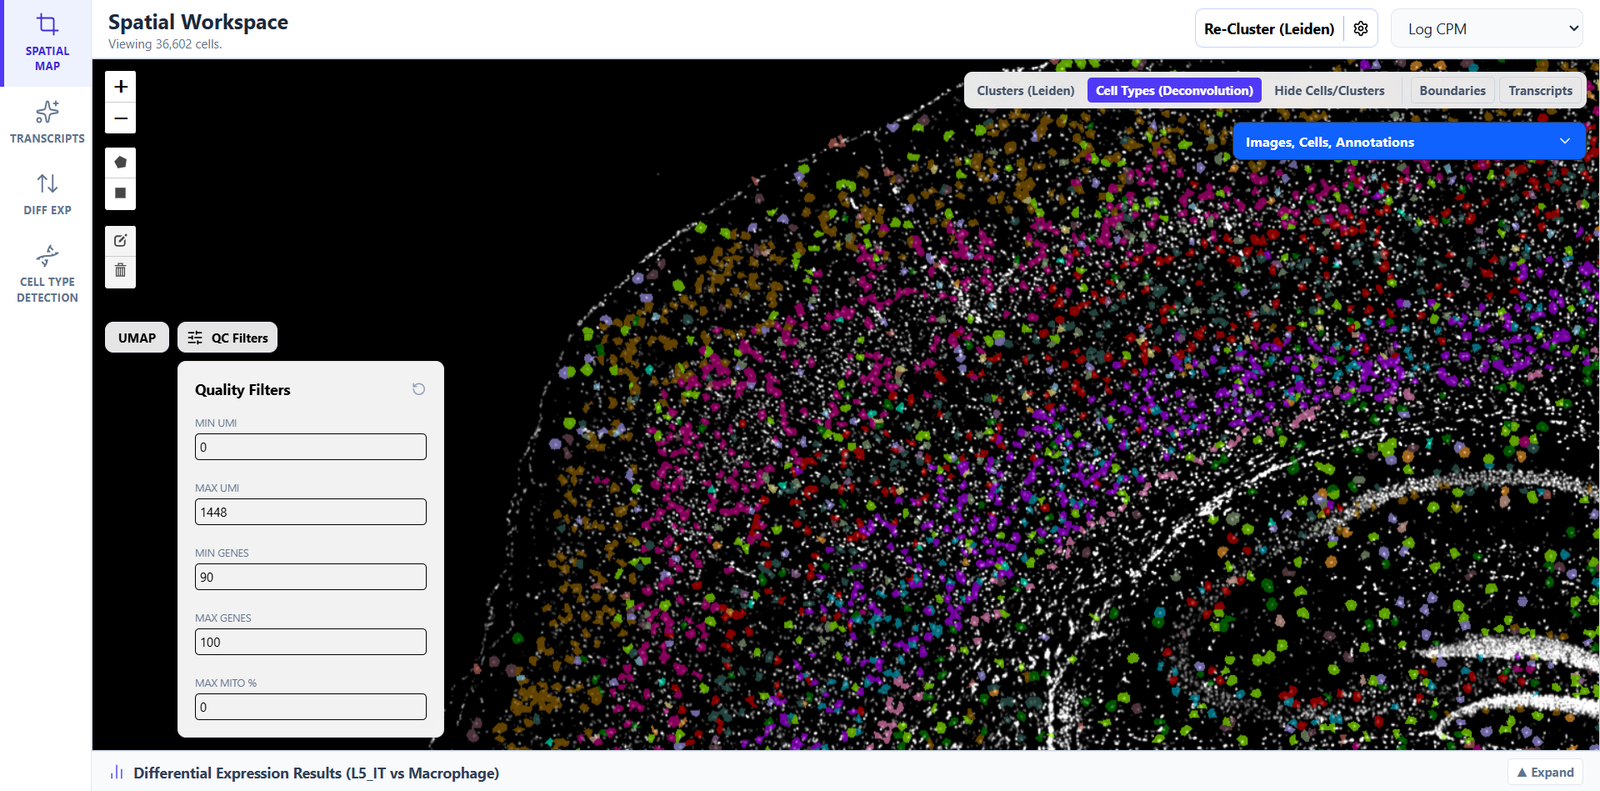
You can perform QC (with real-time visualization), perform Leiden clustering, perform Seurat-backed UMAP projection calculation, annotate clusters manually with the help of marker gene visualization, view cell/nucleus boundaries, and view feature plot (gene expression heatmap) for each transcript easily, interactively an without writing a single line of code.
Complete Local Raw-to-Counts Bulk RNA-Seq Pipeline
We have expanded the application from downstream analysis to cover standard upstream processing. You can now run a complete local pipeline to go from raw FASTQ files to count matrices. We leverage local environments to run:
FastQC & Trimmomatic (for raw QC and trimming)
HISAT2 (for alignment)
featureCounts (for quantification)
Updated Licensing: Free for Students
During our last thread, Professor Istvan Albert Istvan Albert correctly highlighted that graduate students and academic researchers often lack the discretionary funding to pay for commercial licenses for tools with academic origins. We have updated our model: Jetomics is now free forever for students and academic researchers. In addition, we are offering a 1-year free license for all other early adopters to help us refine and stress-test the platform.
We are fortunate to already have active users at institutions including Johns Hopkins School of Medicine, Zhejiang Cancer Hospital, Hamad Medical Corporation, Shandong University, BioChain Institute Inc, and various other labs globally.
We are actively seeking more early adopters to help us stress-test every single feature in Jetomics. If you have any technical questions about how we handle local memory, WSL integration, or if you run into any performance bottlenecks, I would be very happy to discuss them here!
You can download Jetomics v2.0 directly at: https://jetomics.com
Happy to answer any questions!
0 answers
No answers yet.
Log in to answer this question.