Co-expression of markers in single cells using scanpy
Hello,
I am new to the world of single cell analysis, but scanpy has been useful for my analyses so far. However, I want some way to visualise the co-expression of two marker genes in single cells on a UMAP. I noticed that Seurat has a nice way to show this using Feature Plot and blend:
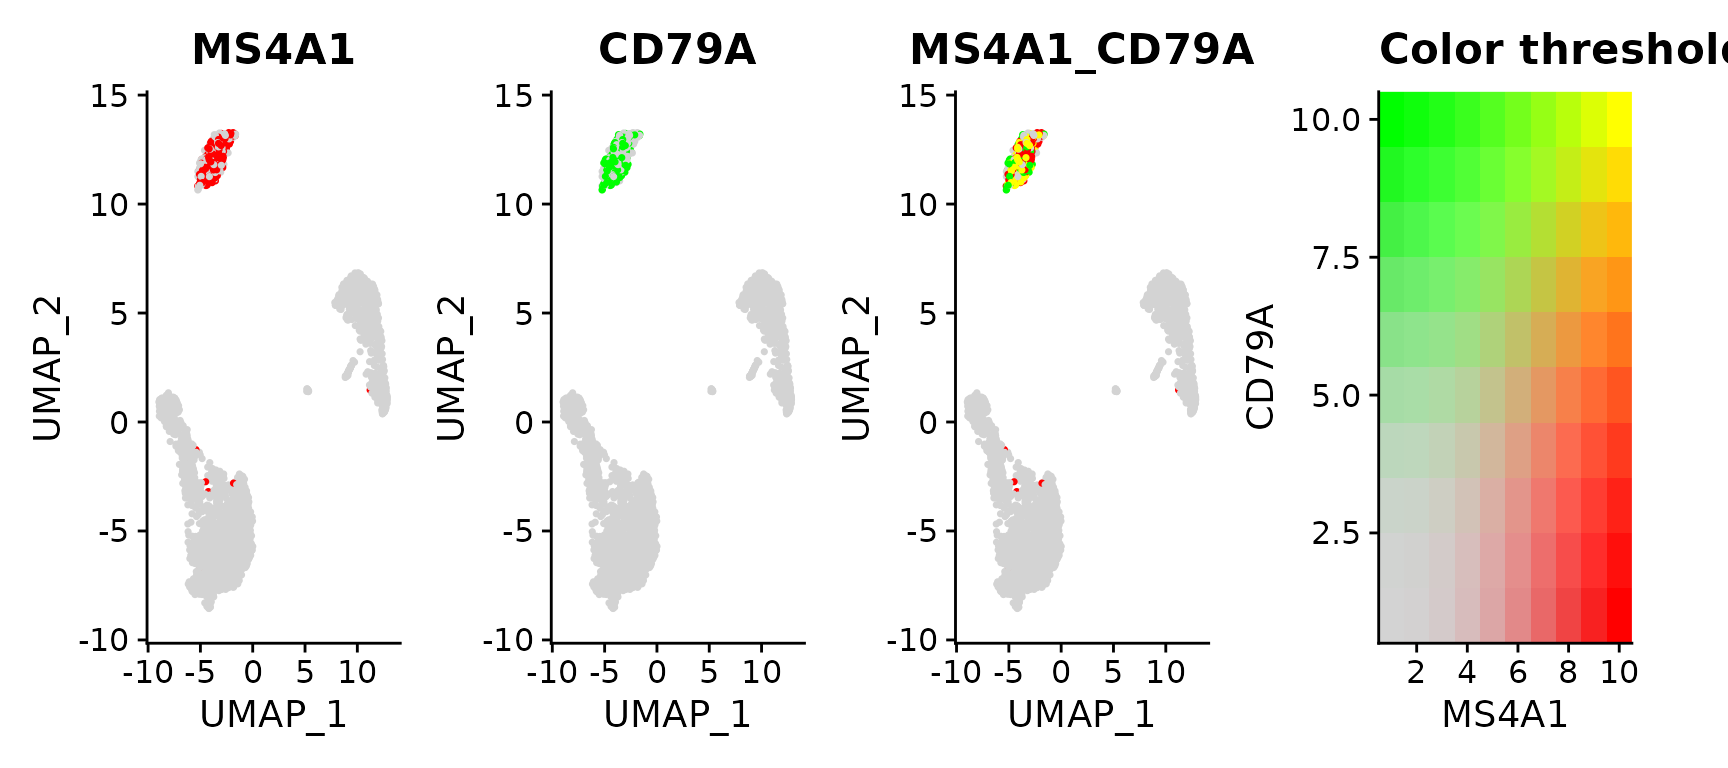
I am not familiar with R. Does anybody know if there an easy way to do this using scanpy/pytjon based methods?
• 2,804 views
•
link
0 answers
No answers yet.
Log in to answer this question.
You could do something like this- It will be very close to seurat.
Thank you. However, I think this does not account for the case of intermediate expression of two markers in a single cell. E.g one cell had high expression of only GeneA, another cell has high expression of Gene B, and a third intermediate expression of A+B, the UMAP will look uniform. Have I got that right?