
agree. I jotted out some pseudocode for him, let me know if you see any probs with it
• 0 views
•
link
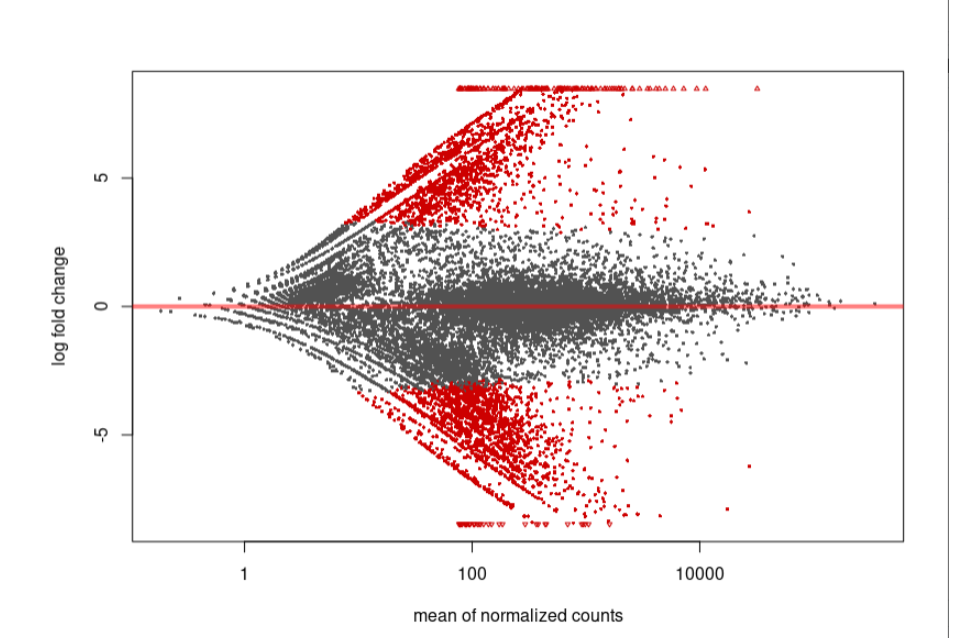
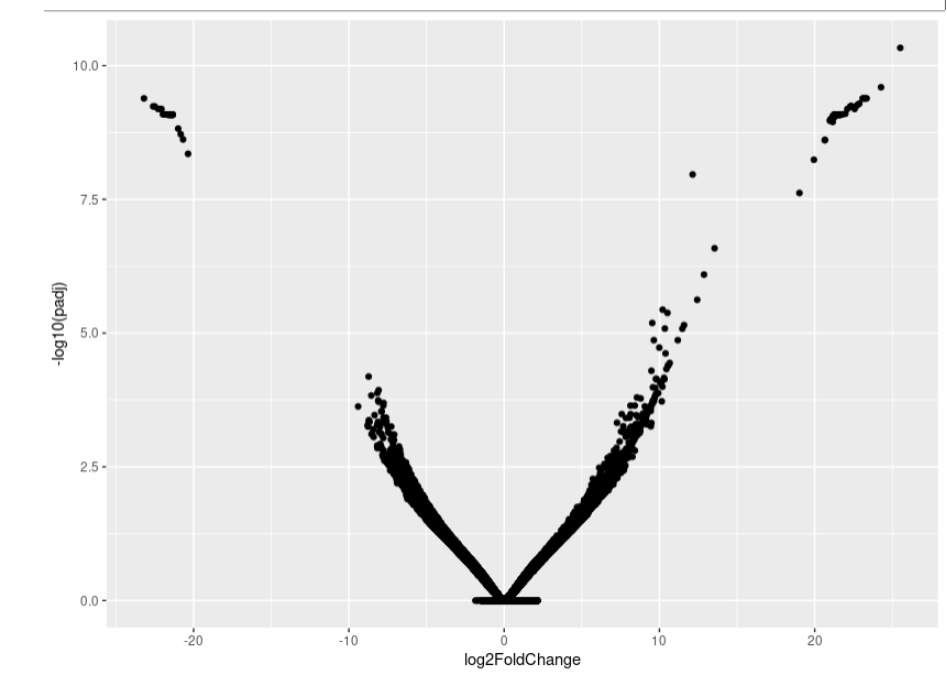
Hi, every one. I find a werid MAplot or volcano plot of DESeq reuslt. I am wondering whether you can give me some advice.
This diff result is from two cell type bulk RNA-seq. I use two specific marker to get these two cell type using Flow cytometer. I alreadly know these cell type have very different RNA composition.
As you can see, the MA-plot is not like DESeq2 manul example. And the volcano plot is more werid, it looks like -log10(padj) is the linear function of log2FoldChange.
have post same question in Bioconductor support. Here is the link.
If you can not see the picture, Here is the two link
MA-plot:
Volcano:
If you want to repeat my data, here is my data link:
https://github.com/shangguandong1996/picture_link/blob/main/WFX_count_Rmatrix.txt
And here is my code
# Prepare -----------------------------------------------------------------

# load up the packages
library(DESeq2)
library(dplyr)

library(ggplot2)

# Set Options
options(stringsAsFactors = F)

# load up the data
data <- read.table("rawdata/count/WFX_count_Rmatrix.txt",
                   header = TRUE,
                   row.names = 1)

coldata <- data.frame(row.names = colnames(data),
                      type = rep(c("Fx593", "Fx600"), each = 2))


# DESeq2 ------------------------------------------------------------------

dds <- DESeqDataSetFromMatrix(countData = data,
                              colData = coldata,
                              design= ~ type)
# PCA
vsd <- vst(dds)
plotPCA(vsd, intgroup = "type")

dds <- DESeq(dds)

res_lfc <- lfcShrink(dds = dds,
                     type = "ashr",
                     coef = "type_Fx600_vs_Fx593")

plotMA(res_lfc)

as_tibble(res_lfc) %>%
    mutate(padj = case_when(
        is.na(padj) ~ 1,
        TRUE ~ padj
    )) %>%
    ggplot(aes(x = log2FoldChange, y = -log10(padj))) +
    geom_point()
> sessionInfo()
R version 3.6.1 (2019-07-05)
Platform: x86_64-pc-linux-gnu (64-bit)
Running under: CentOS Linux 7 (Core)

Matrix products: default
BLAS:   /opt/sysoft/R-3.6.1/lib64/R/lib/libRblas.so
LAPACK: /opt/sysoft/R-3.6.1/lib64/R/lib/libRlapack.so

locale:
 [1] LC_CTYPE=en_US.UTF-8       LC_NUMERIC=C
 [3] LC_TIME=en_US.UTF-8        LC_COLLATE=en_US.UTF-8
 [5] LC_MONETARY=en_US.UTF-8    LC_MESSAGES=en_US.UTF-8
 [7] LC_PAPER=en_US.UTF-8       LC_NAME=C
 [9] LC_ADDRESS=C               LC_TELEPHONE=C
[11] LC_MEASUREMENT=en_US.UTF-8 LC_IDENTIFICATION=C

attached base packages:
[1] parallel  stats4    stats     graphics  grDevices utils     datasets  methods
[9] base

other attached packages:
 [1] ggplot2_3.3.3               dplyr_1.0.5
 [3] DESeq2_1.26.0               SummarizedExperiment_1.16.0
 [5] DelayedArray_0.12.0         BiocParallel_1.19.6
 [7] matrixStats_0.58.0          Biobase_2.46.0
 [9] GenomicRanges_1.38.0        GenomeInfoDb_1.22.0
[11] IRanges_2.20.0              S4Vectors_0.24.0
[13] BiocGenerics_0.32.0

loaded via a namespace (and not attached):
 [1] bitops_1.0-7           bit64_4.0.5            doParallel_1.0.15
 [4] RColorBrewer_1.1-2     tools_3.6.1            backports_1.2.1
 [7] utf8_1.2.1             R6_2.5.0               rpart_4.1-15
[10] Hmisc_4.5-0            DBI_1.1.1              colorspace_2.0-1
[13] nnet_7.3-16            withr_2.4.2            tidyselect_1.1.0
[16] gridExtra_2.3          bit_4.0.4              compiler_3.6.1
[19] cli_2.5.0              htmlTable_2.1.0        labeling_0.4.2
[22] scales_1.1.1           checkmate_2.0.0        SQUAREM_2017.10-1
[25] genefilter_1.68.0      mixsqp_0.2-2           stringr_1.4.0
[28] digest_0.6.27          foreign_0.8-73         XVector_0.26.0
[31] pscl_1.5.2             base64enc_0.1-3        jpeg_0.1-8.1
[34] pkgconfig_2.0.3        htmltools_0.5.1.1      fastmap_1.1.0
[37] htmlwidgets_1.5.3      rlang_0.4.11           rstudioapi_0.13
[40] RSQLite_2.2.7          generics_0.1.0         farver_2.1.0
[43] RCurl_1.98-1.3         magrittr_2.0.1         GenomeInfoDbData_1.2.2
[46] Formula_1.2-4          Matrix_1.3-2           Rcpp_1.0.6
[49] munsell_0.5.0          fansi_0.4.2            lifecycle_1.0.0
[52] stringi_1.5.3          MASS_7.3-54            zlibbioc_1.32.0
[55] grid_3.6.1             blob_1.2.1             crayon_1.4.1
[58] lattice_0.20-44        splines_3.6.1          annotate_1.64.0
[61] locfit_1.5-9.4         knitr_1.33             pillar_1.6.0
[64] geneplotter_1.64.0     codetools_0.2-18       XML_3.99-0.3
[67] glue_1.4.1             packrat_0.5.0          latticeExtra_0.6-29
[70] data.table_1.12.6      png_0.1-7              vctrs_0.3.8
[73] foreach_1.4.7          gtable_0.3.0           purrr_0.3.3
[76] assertthat_0.2.1       ashr_2.2-39            cachem_1.0.4
[79] xfun_0.22              xtable_1.8-4           survival_3.2-11
[82] truncnorm_1.0-8        tibble_3.1.1           iterators_1.0.12
[85] AnnotationDbi_1.48.0   memoise_2.0.0          cluster_2.1.2
[88] ellipsis_0.3.2
Just to reference my comment from the cross-post, the main issue here is probably that the majority of genes has zeros in at least two or more of the four samples which then makes it difficult to come up with any kind of meaningful fold change estimation, which then causes these spurious DE calls in the MA-plot: https://support.bioconductor.org/p/9139060/#9139066
You can even test yourself that replicate number is not the issue here by simply a mocking up 20 samples per group (just copying the samples that you have 10 times) and then repeat the analysis. The MA-plots look similar towards the odd shape while prefiltering removes most of that. Code here, MA-plots below (not colored for significant genes as this would make things too messy here for the eye). While prefiltering is not strictly necessary for DESeq2 it seems to make sense here due to the large number of genes with some, but very low counts and many zeros.
agree. I jotted out some pseudocode for him, let me know if you see any probs with it
I updated my answer with a short demo that replicate number (imo) is not the issue here but prefiltering is.
Thanks, AT.
I believe your answer is right. The too many 0 count gene makes lfc shrink not work very well.
And I also find a interesting thing about lfc shrink algorithms in this type data
I was wondering how a PCA plot would look like for your data. As you mentioned, you are comparing very different cell types, that are likely to have a very different transcriptome. I also see that you only have two replicates each, four samples in total, so I believe that you cannot assess variation in each cell type very well. Therefore I would say it's not very surprising to see that there are a lot of genes with a very significant difference in expression, which goes hand in hand with the logFC. If there's little variation among replicates, bigger changes will lead to higher statistical significance.
Hi,Martombo.
Here is my PCA result.
As you mentioned,
If there's little variation among replicates, bigger changes will lead to higher statistical significance.
But when I do other normal bulk RNA-seq, the variation among replicate is also small, but the volcano or MA-plot will not be so weird.
Based on your PCA, there is a large variation for two replicates of FX600 sample, that could affect DE results. In fact, we expect more between-group variation than a within-group variation to obtain desirable results.
The replicate may be the issue as Martombo mentioned. Generally, you need at least 3 replicates, especially with DESeq that is recommended for three and more replication. You can try edgeR that can handle even one replicate.
Thanks your reply, seta.
Please correct me if I misunderstand something.
Most variation is on PC1(79%), but FX600 replicates variation is samll on PC1, so I believe within-group replicate is good.
And if variation is big within replicates, there should be much no-significant genes in volcano plot, but as you can see, the diff gene number is big.
seta - that's interesting. Do you know why edgeR is better in those ...er.. edge cases (with low numbers of replicates)?
I think you are missing some standard QC from your code. I would start by adding the following to your code:
My_Threshold<-10
ddsHTSeq_remove_zeros <- ddsHTSeq_coding[ rowMeans(counts(ddsHTSeq_coding)) > My_threshold, ]
dds<-ddsHTSeq_remove_zeros
You might also use something like rowMedians to account for the point that ATpoint is making, as well.
This isn't directly related, but I also want to mention it can be good to run QC of other kinds as well; for example my code base reads like the following:
gene_types <- read.table(paste(meta_data_dir, "/ensembl_gene_type.txt", sep=""), sep=",", stringsAsFactors=F, header=T) #
protein_coding <- gene_types[gene_types$Gene.type == "protein_coding", ]                                    # make list of only coding genes
ddsHTSeq_coding <- relevelled_dds[(rownames(counts(relevelled_dds)) %in% protein_coding$Gene.stable.ID),]   # Remove non-protein coding transcripts
ddsHTSeq_remove_zeros <- ddsHTSeq_coding[ rowMeans(counts(ddsHTSeq_coding)) > count_threshold, ]                            # Remove genes with no reads first, so that quartiles can be calculated
dds<-ddsHTSeq_remove_zeros
design(dds)<-design_statement
dds_to_compare[[ platform_name ]]<-dds
the first few lines restrict to protein coding genes etc; not appropriate for every analysis but just presenting it to give you ideas. Good luck!
Log in to answer this question.
