ComplexHeatmap break values appear different in the plots
Hi,
I am using ComplexHeatmap package for plotting. One strange thing I noticed is that, heatmap does not take maximum and minimum break values as specified using max and min functions from R.
Code/commands used:
> min(xm)
[1] -5.460918
> max(xm)
[1] 9.361317

> Heatmap( xm, col = colorRamp2(c(min(xm), 0, max(xm)), c("#6E6E6E", "white", "#31B404")), show_row_names = F, km = 2, column_names_gp = gpar(fontsize = 7), name="Tumors" )
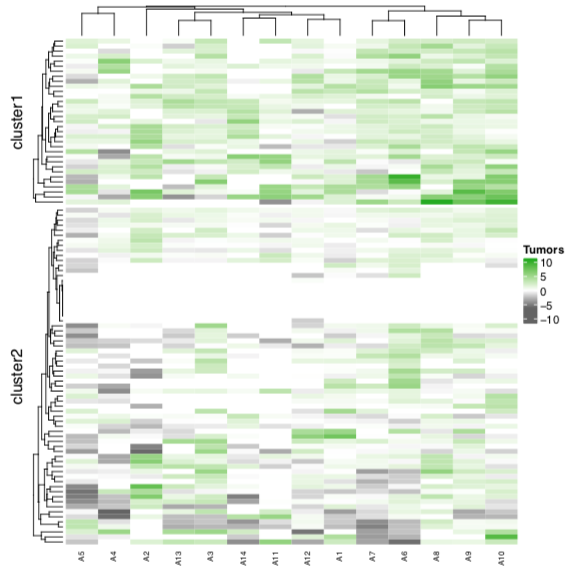
Please let me know if I am doing something wrong.
My session information:
> sessionInfo()
R version 3.5.0 (2018-04-23)
Platform: x86_64-pc-linux-gnu (64-bit)
Running under: CentOS Linux 7 (Core)

Matrix products: default
BLAS: /sw/apps/R/x86_64/3.5.0/rackham/lib64/R/lib/libRblas.so
LAPACK: /sw/apps/R/x86_64/3.5.0/rackham/lib64/R/lib/libRlapack.so

locale:
 [1] LC_CTYPE=en_US.UTF-8       LC_NUMERIC=C
 [3] LC_TIME=en_US.UTF-8        LC_COLLATE=en_US.UTF-8
 [5] LC_MONETARY=en_US.UTF-8    LC_MESSAGES=en_US.UTF-8
 [7] LC_PAPER=en_US.UTF-8       LC_NAME=C
 [9] LC_ADDRESS=C               LC_TELEPHONE=C
[11] LC_MEASUREMENT=en_US.UTF-8 LC_IDENTIFICATION=C

attached base packages:
[1] grid      stats     graphics  grDevices utils     datasets  methods
[8] base

other attached packages:
[1] circlize_0.4.6        pheatmap_1.0.12       RColorBrewer_1.1-2
[4] gridExtra_2.3         ggplot2_3.2.1         ComplexHeatmap_1.20.0
[7] reshape2_1.4.3        svMisc_1.1.0

loaded via a namespace (and not attached):
 [1] Rcpp_1.0.2          magrittr_1.5        tidyselect_0.2.5
 [4] munsell_0.5.0       colorspace_1.4-1    R6_2.4.0
 [7] rjson_0.2.20        rlang_0.4.0         stringr_1.4.0
[10] plyr_1.8.4          dplyr_0.8.3         tools_3.5.0
[13] gtable_0.3.0        withr_2.1.2         assertthat_0.2.1
[16] lazyeval_0.2.2      tibble_2.1.3        crayon_1.3.4
[19] purrr_0.3.2         GlobalOptions_0.1.0 glue_1.3.1
[22] shape_1.4.4         stringi_1.4.3       compiler_3.5.0
[25] pillar_1.4.2        scales_1.0.0        pkgconfig_2.0.2
[28] GetoptLong_0.1.7
Note: Also posted this on GitHub.
• 6,046 views
•
link
0 answers
No answers yet.
Log in to answer this question.
Could you save your heatmap in an object and print the contents of
my_heatmap@matrix_color_mapping, pleaseSorry, I am not able to understand your suggestion. Can you please explain ?
He means:
See also https://github.com/jokergoo/ComplexHeatmap/issues/82 for the developers answer on this. At the bottom of this issue he has some suggestions on how to avoid the default breaks. Using
quantileon your matrix allows setting data-driven cutoffs for the range. See the issue for details.Dear ATpoint, thanks a lot for your suggestion. My problem is exactly opposite to the issue mentioned in the link you provided. I am not using default breaks, providing the breaks using
minandmaxfunction. Above heatmap I provided is having symmetric legend scale, but my data does not haveminandmaxvalues as symmetric. I do not want to spread the gradient up-to '-10' when the data/matrix has the minimum value of '-5.460918'. Instead I would like to stop the gradient fill at exact minimum (not possible) or atleast -6 (round-off).I have been communicating with the developer. Here is the link for reported issue, https://github.com/jokergoo/ComplexHeatmap/issues/361
Heatmapfunction doesn't recognize the break values I mentioned usingminandmax.