thanks was very helpful;)
• 0 views
•
link
Hei everyone,
for my project i did capture sequencing of mulitple individuums. Somehow the depth and coverage is not as high as expected. Now i want to plot the output of samtools depth. Unfortunatly i am not able to write a perfect code, so I thought i ask here for help. I would like to create via R on the server a histogramm. On the x-axis should be plotted the position in basepairs and on the y-axes the depth. The bins of the x-axis should conclude 1Mbases and at last it would be perfect if each bin shows its mean depth. I allready used samtools coverage but i would like to see also the visualization of samtools depth. I know it is a big request, but if you can help me i would be very greatful;). May you can also share here your codes you are using for your visualization.
Thanks a lot
Dominik
The easiest way to do this is probably using deeptools plotCoverage. You get what you want with just one command, and the documentation is super clear on how to do it.
thanks was very helpful;)
I have a similar question, thus I do not want to do a similar post:
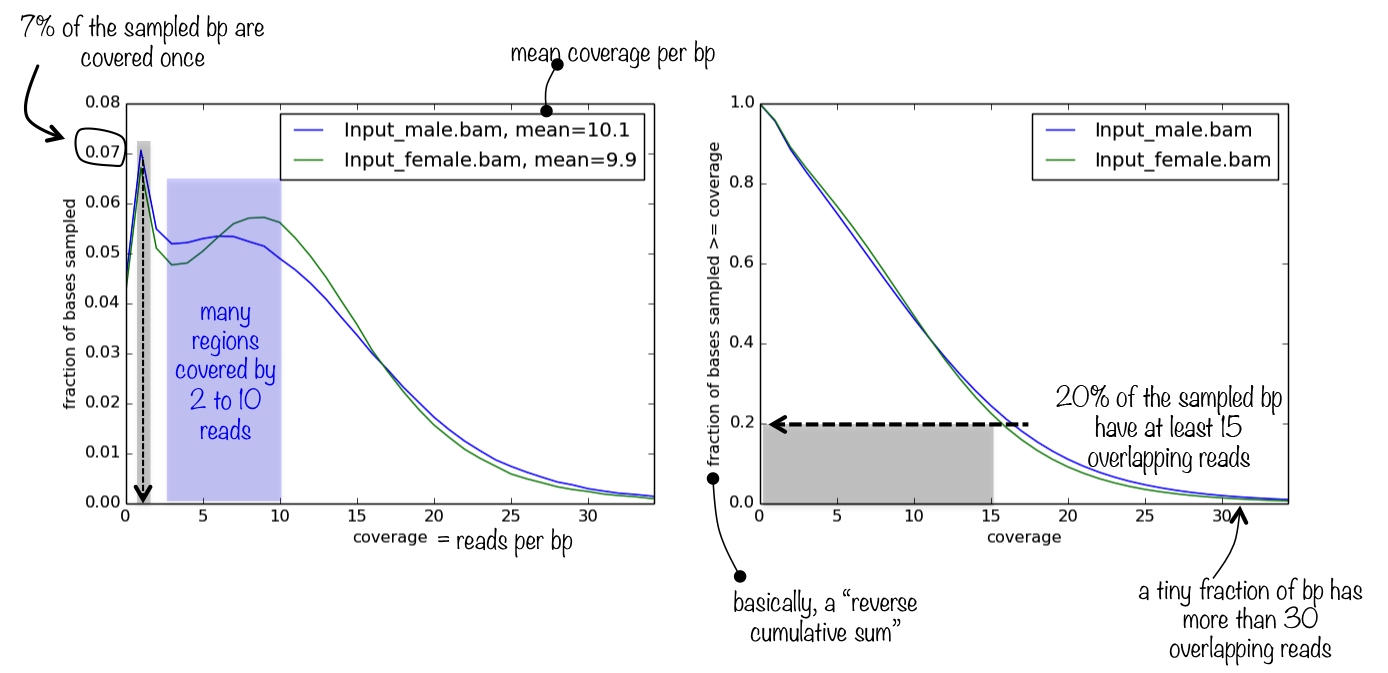
Given the following coverage plot from deeptools. I should have a mean of 100X coverage across all the exome. From this post I learned that is me mean coverage per bp. Thus, how can I get this 100X ? given the fact that I am working only on the entire exome ?
You probably should ask a separate question and add more details. For instance, it is unclear why you should have 100x coverage ? And what kind of experiment you are talking about.
Log in to answer this question.

If you're using
samtools depthand the coverage isn't what you expect, it's likely the inbuilt limit of maximum depth (-m). This is because it uses the slow pileup engine. I completely rewrote the depth command for samtools 1.13 and so it's much much faster on very deep data and also no longer has the paradox of needing a maximum depth limit!Besides, upgrading to the latest version brings other benefits anyway.
As for plotting, personally I tend to use hacks of awk and gnuplot, but I'm a bit of a luddite like that. :-)