
Hi, everyone.
I recently reading the Cistrome-GO: a webserver for functional enrichment analysis of transcription factor ChIP-seq peaks, in which the The regulatory potential score (RP score) idea attracted me.
The formula is below
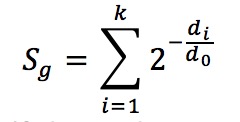
The parameter d0 is the half-decay distance, with default value 1 kb for promoter-type TFs and 10 kb for enhancer-type TFs. (Users can also specify the parameter to other values in the advanced settings). All k binding sites near the TSS of gene g (within the distance 15 * d0) will be used in the calculation, and di is the distance between the ith peak’s center and TSS.
For a given input ChIP-seq peak file, an RP score is calculated for each gene. The gene rank RRP is derived by decreasing RP score.
But I am wondering whethe I can combined other quantitative indicator, like peak score when considering RP score. I try to use the mean peak score rank like author use gene Diff rank to integrate RNA-Seq data, but I find it seems not suitable.
For example, if geneA has 3 associated peak, and the peak score rank is 1, 30, 15000. And another gene B has 3 peak, which has 1000, 1200, 1500 . We can see gene A is more important than B, but the final mean rank shows that geneB is important than A.
So I am wondering whether someone can give me some advice or other paper.
Best wishes
Guandong Shang