You are right - there are TruSeq adaptors among the overrepresented sequences. I'll remove them and then re-run fastqc.
• 0 views
•
link
I ran FatsQC on a set of 4 Illumina PE exomes and got really weird graphs for the kmer distribution. I've never seen this pattern before - does anyone know what is going on and what to do about it?
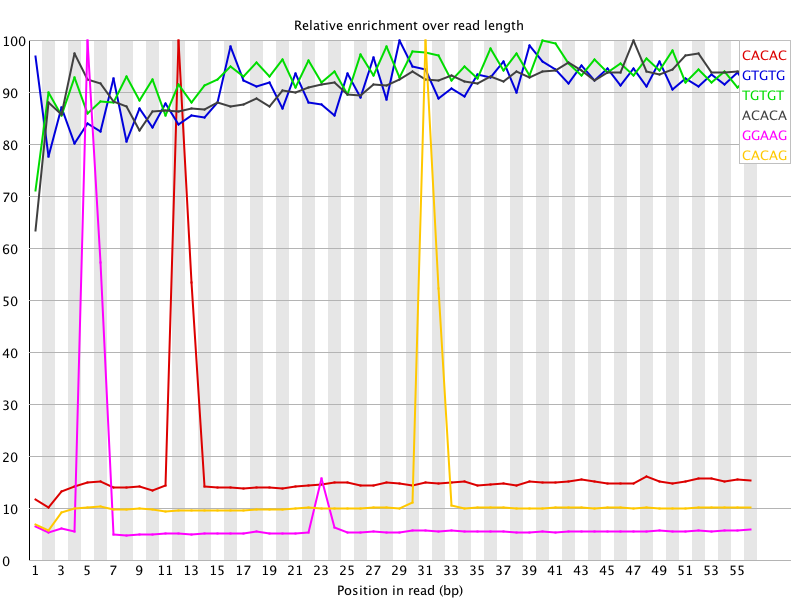
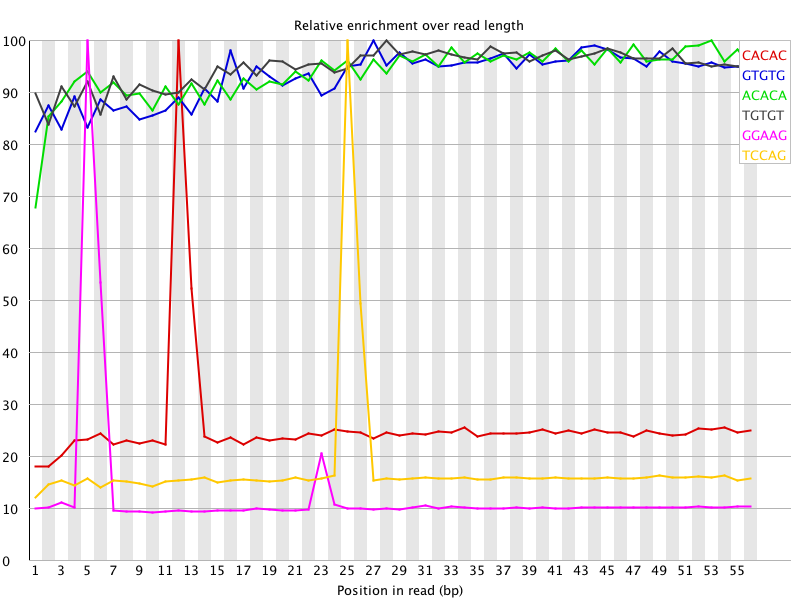
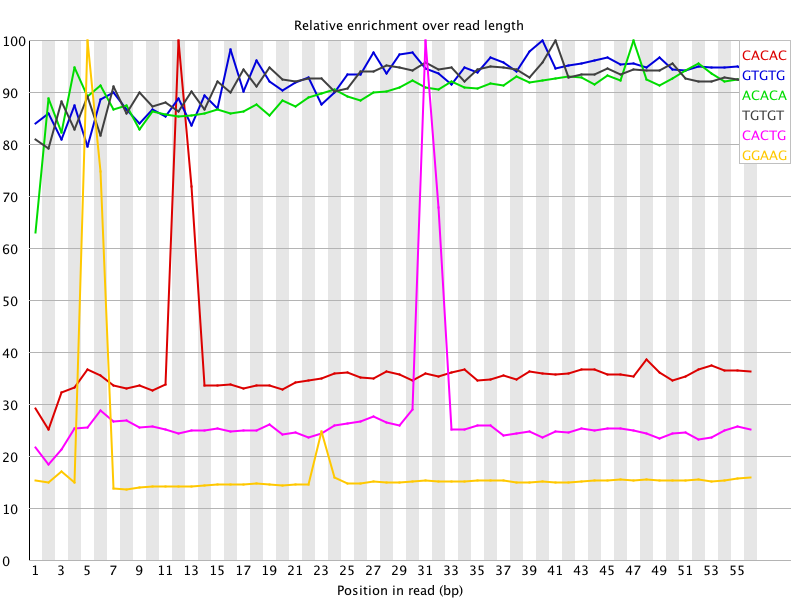
Those k-mers almost perfectly correspond to the TruSeq adapter sequence. Was there anything peculiar that showed up in the overrepresented sequences table?
You are right - there are TruSeq adaptors among the overrepresented sequences. I'll remove them and then re-run fastqc.
@kelvin.c.chan: I did remove the over-represented sequences for one of the samples and the graph changed somewhat but there are still peaks (see below) although fastqc no longer reports any over-represented sequences. Any ideas?
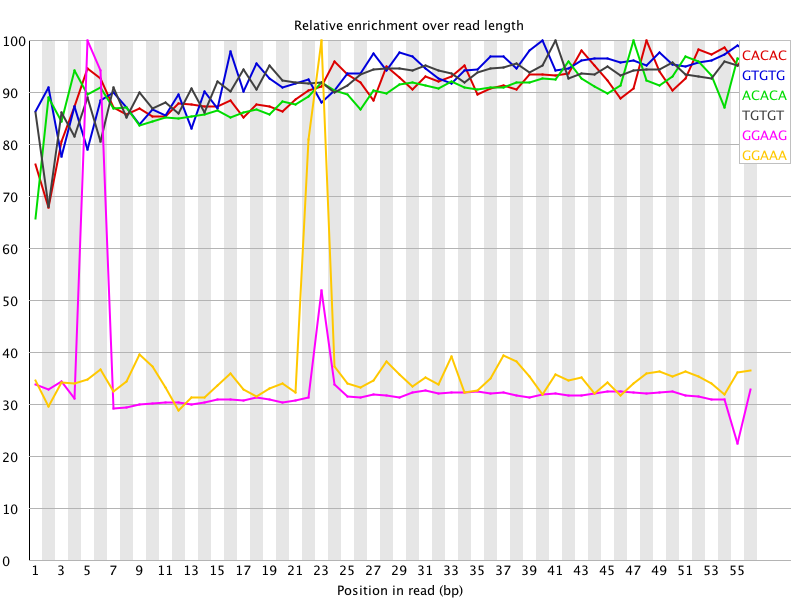
How did you remove the TruSeq-containing sequences?
Log in to answer this question.