what is the command used to create this picture?
Thanks.
Elzed
• 0 views
•
link
I used multiple structural variant(SV) callers to call SVs for paired end sequencing data.
Which genome browser offers the best support to visually inspect paired en sequencing data. I want to load the mapped paired end sequencing bams and then visually inspect the regions the SV callers marked as having structural variations.
You can use IGV for visulisation of your mapped files www.broadinstitute.org/igv/ but for structural variant i recomanded you to use InGAP-SV (http://ingap.sourceforge.net/) that is nice tools for both detection and visualisation of severals kind of structural variations (Large insertions, translocation, deletion, inversions....) Hope that will help you .
Through a similar post (http://www.biostars.org/post/show/19455/which-multiscale-genome-browser-is-the-best-at-visualizing-structural-variants/) I found the genome browser Savant.
Savant visualizes read pairs with arches, that show the distance between the read pairs and the colour shows the type of mapping ( concordant length, discondant length, on read inverted, everted pair, unmapped mate) .
I looks works really nice.
the tool: http://genomesavant.com/savant/
the arcs: http://genomesavant.com/savant/images/screens/screen_6a.png
The best visualisations I've seen so far (albeit not with a genome browser) were made custom Circos plots with structural varion data, e.g.:
Rausch et al. (2012). Genome Sequencing of Pediatric Medulloblastoma Links Catastrophic DNA Rearrangements with TP53 Mutations. Cell 148(1). [link]
Not a genome browser, but the tool Pairoscope was created to help visualize SVs, the reads that support the SV event and depth of coverage near the breakpoints:
Pairoscope requires at least one bam file to run. Your bam file should be sorted and indexed. The help output for pairoscope is below.

Usage:   pairoscope [options] <align.bam> <chr> <start> <end> <align2.bam> <chr2> <start2> <end2>
Options: -q INT    minimum mapping quality [0]
     -p FLAG   output in pdf instead of png
     -b INT    size of buffer around region to include [100]
     -n FLAG   print the normal pairs too
     -o STRING filename of the output png
     -W INT    Width of the document [1024]
     -H INT    Height of the document [768]
     -g STRING bam file of exons for gene models
     -f STRING list of types of maq flags for display
Example output:
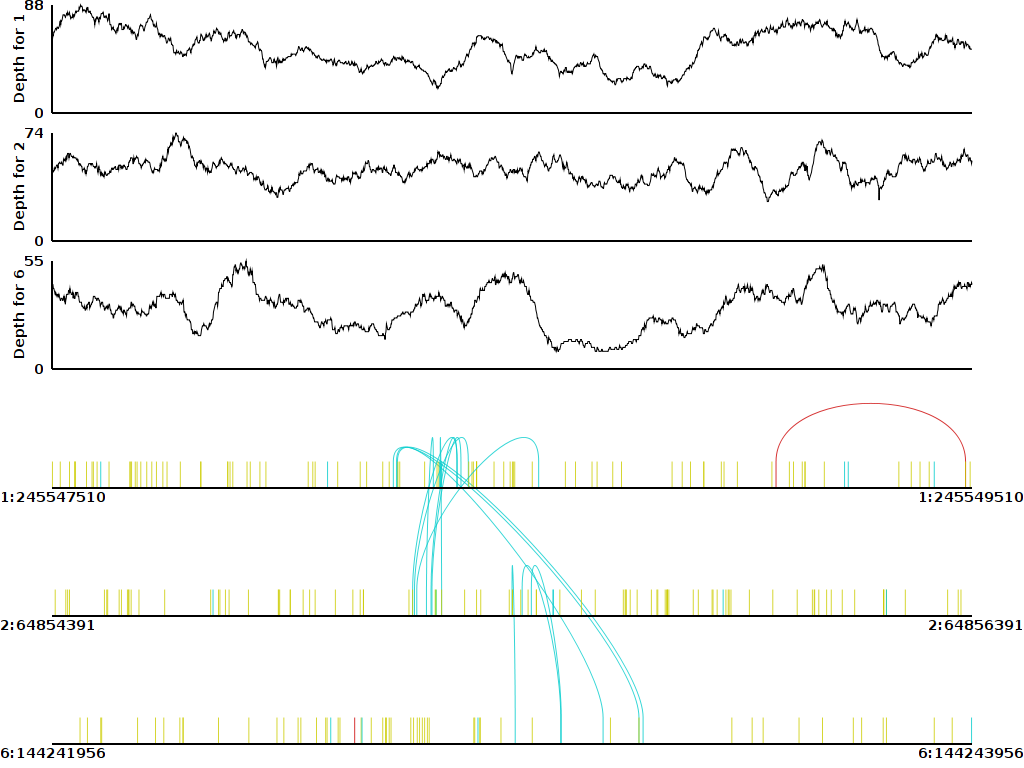
what is the command used to create this picture?
Thanks.
Elzed
Nice! Can you perhaps briefly outline a strategy for visualizing the output of GASVPro? How do you review predicted SVs in evaluating the outcome. Comments on validation strategies would also be greatly appreciated...
The New Genome Browser (NGB) is designed to visualise Structural Variations (SVs) and their supporting reads
Log in to answer this question.


I was about to reply 'IGV', but I've found IGV very difficult to use when you want to visualize the SVs (especially when you have to compare several BAMs on the same screen)