Mapping after WGS show a parabel form
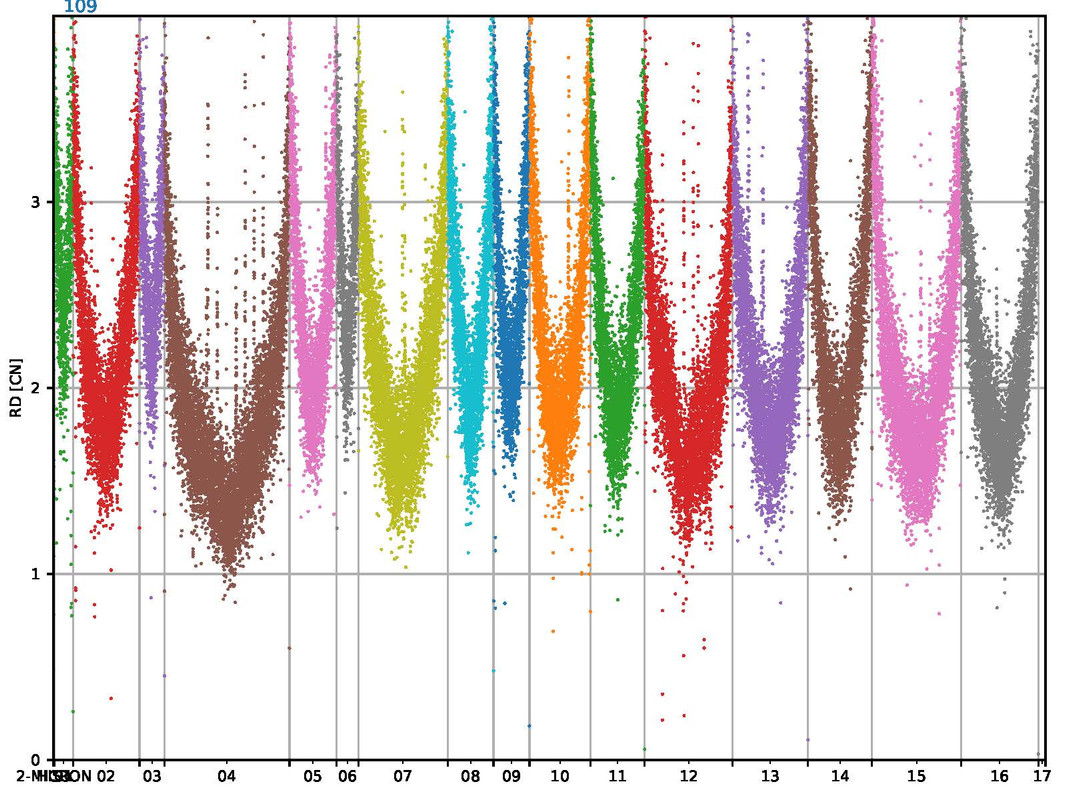
I would like to hear your opinion to the results of my Whole-Genome-Sequencing (WGS) I did with samples from a S. cerevisiae strain.
After mapping the samples with bwa, marking duplicate (Picard) and doing variant calling (bcftools) and CNV discovery (cnv.kit and CNVpytor) I have plotted the results and got a strange behavior of my results.
The mapping looks very consistent and the mapping results are >99% with good quality. But somehow I haven't seen this kind of mapping before. It looks like a parabel, but for all the sequences (s. attached image).
CAn anyone explain this behavior? I am not sure how to interpret this results
thanks
• 1,511 views
•
link
0 answers
No answers yet.
Log in to answer this question.
Hi Assa,
I recently started using CNVpytor myself and got different results. My read depth is a lot more even, but I only have used human samples this far.
CNV-calling is new for me but I read something about GC-bias. Maybe the GC content is lower or higher at the start and end of chromosomes in S. cerevisiae? (just guessing)
The problem I am encountering is that my data is not looking normalized and that might also be the problem in your case? I feel read depth data should be normalized to 1 so that you could properly indicate deletions or duplications. But I am not sure how to do normalization for this data... (maybe someone else could help with that?)
Please let me know your follow-up steps because that could help me aswell.
Have a nice day!
Hi I tried to use cnvpytor to detect cnv in cow. But it seems it is not accepting my input file. I would like to see the steps to prepare the cnvpytir input file. Thanks