Entering edit mode

5.0 years ago
Assa Yeroslaviz
★
1.8k
I was wondering if the results of my fastqc run are to be expected under the circumstances.
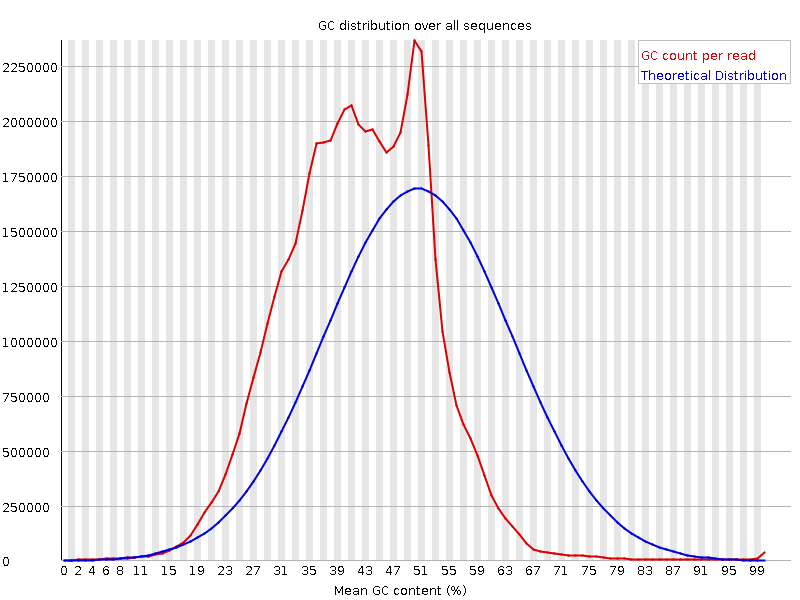
We are running some 10x Genomics (single-cell) data sets and get a strange GC content plot when running the fastqc tool
In the case of the image attached, the basic statistics tells me, the GC content should be around 41%. But even the theoretical distribution in the plot is around 51% while the true one is difficult to interpret.
So my questions are -
- can I still assume the data is good enough? It doesn't look like there is contamination in the fastq files.
- Can it be, that the reason for this behavior is the specific structure of the 10x Genomics sequences, including the barcodes and the UMI?
thanks
I think the data should be fine. If this is for read 1 (which the cell barcodes/UMI's for RNAseq) I would not even do this analysis.
Is this R1 or R2? For R1 fastqc is basically meaningless as you only scan the "technical sequences".
This is from the file of R2, not R1
There could be various things going on. There is strong 3'-bias to 10x scRNAseq (which FastQC has no way to understand). Not sure what to tell you. I have not tried to do FastQC with 10x data.
what better tools are there out there to test the QC of 10x genomics data sets?
Once you do your 10x analysis check to see how many cells you have and the number of reads detected per cell. All those things are highlighted when you look at the set with loupe browser.
I can't say I've looked at this specifically for 10X data, but in general FastQC reports for 3' RNA-seq datasets (single-cell like or the bulk stuff with a kit from Lexogen) tend to look rather odd. My suspicion has always been that this is due to the nature of the 3' end of transcripts.
I'm not really sure what it means. What is different in the 3' end of the transcripts with the scRNA-Seq (or Lexogen kits)? Does it apply only for data from 10x Genomics or all other scRNA-Seq technologies as well?
why does this kind of bias influences the GC content only on the 3' end?
It will affect all kits and I suspect there is a GC bias at the 3' end (likely exacerbated by this being RNA-seq, so there are enrichments of a handful of sequences anyway).
Hi, I also have some problems understanding Fastqc repots for scRNA data These are figures for R1 and R2, I can understand strange GC content/per base content, BUT I do not get the per base sequence quality and per tile sequence quality. The reports basically the same for all R1 files and fro different librarie preps, so that should mean that I just do not understand something simple here. Clarifications will be appreciated!
R1 QC
R2 QC
The R1 sequences should be either 26 or 28 bases long for 10x, depending on the chemistry. Therefore all what is after that are primer/adapter residues. But I think the cellranger can ignore them. see here
I gave it a bit more thoughts and now confused even more (
here is the library pic. from 10x genomic website
R1 if I understand corretcly (and seems that I do not), should looks like: 5'-CellBarcode-UMI-polyA-cDNA-3' And R2: 5'-cDNA-polyA(depending on insert size and seq len)-3'
In my data I see increased A contetnt in R1, which I assume should be polyA/primers/barcodes traces? Why the seq quality is dropping for R1 and not for R2, is it because of the repeats? Actual meaningfull part of the read is thereefore only first ~30bp? Why these appear at 5', when the read was reverse complemented?
There is no need to do FastQC for 10x data. You should proceed with
cellrangeranalysis.Yes, a run it through cellRanger, but I want to understand this QC report ;)
See: https://teichlab.github.io/scg_lib_structs/methods_html/10xChromium3.html (go to bottom of page)
Any time sequencer encounters stretches of same nucleotides software keeping track of the clusters starts having problems which results in reduction in Q scores and strange tile metrics.
Thanks! And also R1 is written in fastq in reverse complement to the actual order of sequencing