thanks, that worked. I was thinking it calls only for ggplot2, good to know that it uses also patchwork. This calls for more visual possibilities
• 0 views
•
link
I was wondering if it is possible to put a title to a DimPlot() which is splitted into two by group.by.
in my example I am using this command to plot my data
DimPlot(seu.Merged, reduction = "tsne", label = TRUE, group.by=c("orig.ident", "seurat_clusters")) + ggtitle('This is a very long title, which should nbe spread over both plots, grouped by Ident (l) and clusters (r)')
But the plot looks like that:
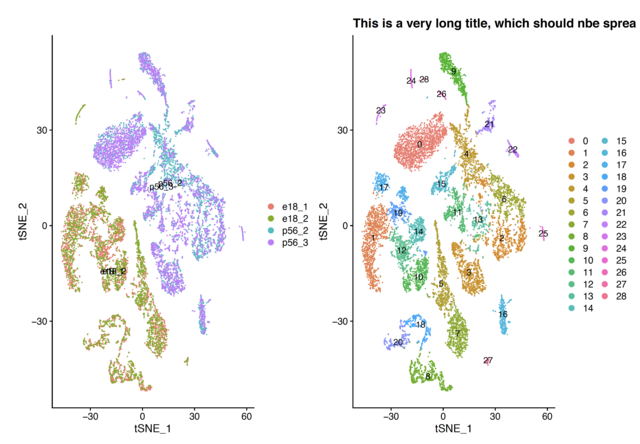
Is there a way to spread the title over both parts of the plot?
DimPlot is calling patchwork to bind two plots together, so it is better to use patchwork to add title, too, try below:
myPlot + plot_annotation(title = 'very very long title, very very long title')
See patchwork manuals for more info:
thanks, that worked. I was thinking it calls only for ggplot2, good to know that it uses also patchwork. This calls for more visual possibilities
Log in to answer this question.