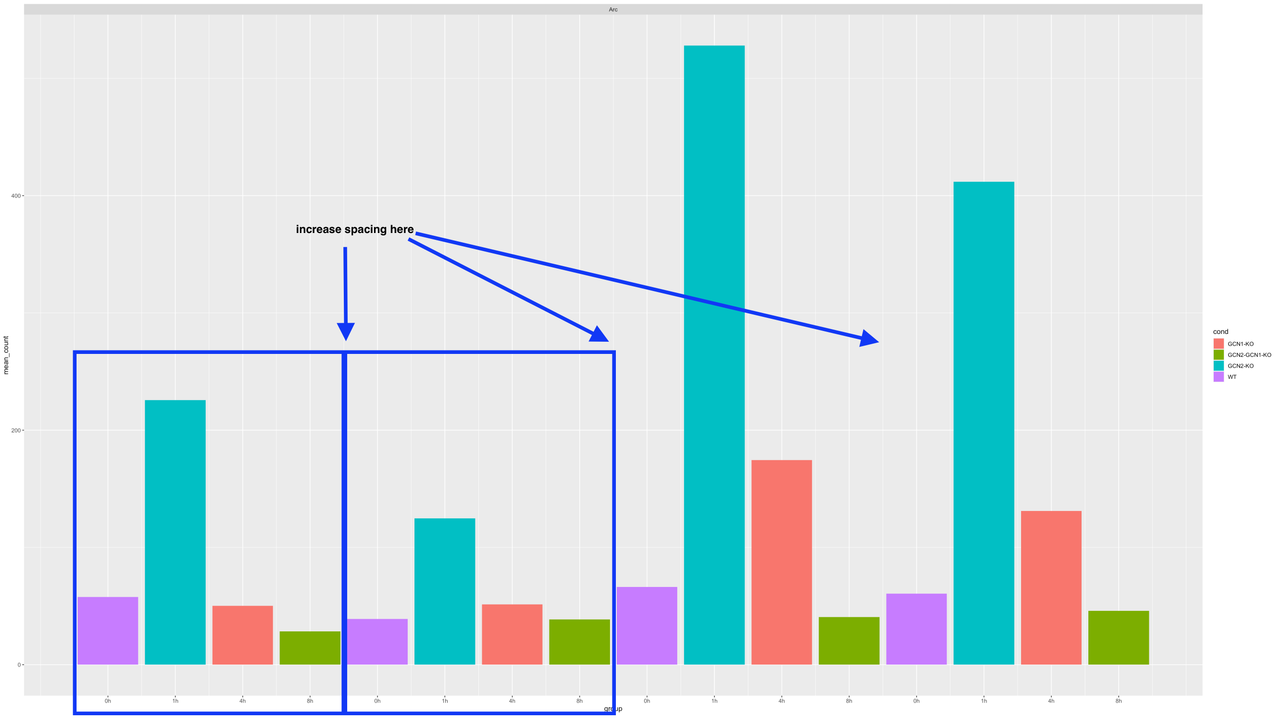
increase spacing between groups in a bar plot
I put this structure into a bar plot
structure(list(mgi_symbol = c("Arc", "Arc", "Arc", "Arc", "Arc",
"Arc", "Arc", "Arc", "Arc", "Arc", "Arc", "Arc", "Arc", "Arc",
"Arc", "Arc"), group = 1:16, mean_count = c(57.8131751359466,
225.701671404033, 50.2793245979203, 28.4576116000487, 38.9853484696232,
124.743897697401, 51.4225337432011, 38.5286843470036, 66.2717149982308,
527.925197470046, 174.55076156097, 40.6146647021935, 60.6998522803835,
411.900936872793, 131.029181008508, 45.8555812038525), cond = c("WT",
"GCN2-KO", "GCN1-KO", "GCN2-GCN1-KO", "WT", "GCN2-KO", "GCN1-KO",
"GCN2-GCN1-KO", "WT", "GCN2-KO", "GCN1-KO", "GCN2-GCN1-KO", "WT",
"GCN2-KO", "GCN1-KO", "GCN2-GCN1-KO")), row.names = c(NA, -16L
), groups = structure(list(mgi_symbol = "Arc", .rows = structure(list(
    1:16), ptype = integer(0), class = c("vctrs_list_of", "vctrs_vctr",
"list"))), row.names = 1L, class = c("tbl_df", "tbl", "data.frame"
), .drop = TRUE), class = c("grouped_df", "tbl_df", "tbl", "data.frame"
))
(this is only a subset of my data I use to facet_wrap to plot the complete dataset)
I would like to better group together each group of four time points and increase the spacing between them, meaning after each 0h,1h,4, and 8h I would like to increase the spacing
I have tried with adding the position_dodge(width = ) parameter, but it doesn't change anyhting visible.
The command I used to create the plot is as such
ggplot(data = d, aes(x=group, y=mean_count, fill=cond)) +
  geom_bar(stat = "identity", width = 0.9, position = position_dodge(width=0.9)) +
  scale_x_continuous(breaks = 1:16, labels=rep(x = c("0h", "1h", "4h", "8h"), times =4)) +
#  scale_x_discrete(breaks=CorrectOrder[-1]) +
  facet_wrap(~mgi_symbol, scales = "free", ncol = 3)
thanks
• 8,643 views
•
link
0 answers
No answers yet.
Log in to answer this question.
quick google search : https://stackoverflow.com/questions/6085238/adding-space-between-bars-in-ggplot2
I have found it myself, thanks. and this is why I added, that I tried with the dodge option, but it didn't work.
could you post your ggplot command in order to reproduce your plot ?
added above, sorry, I forgot.
you don't actually make use of the dodging because your groups are unique. What are the entries of
groupsupposed to capture? You need to add a group ID that captures the sets that you want to plot as a group as shown in the blue square annotation above.EDIT: read your code more carefully, so now I get that these are supposed to be the time slots.