Entering edit mode

3.1 years ago
huangshujia9
•
0
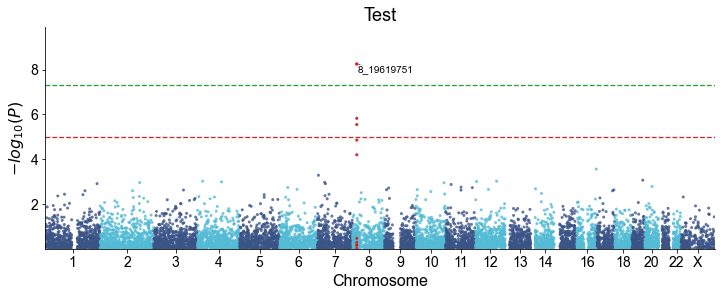
qmplot is a handy, user-friendly Python library and tools that allows for quick and flexible of generating publication-ready manhattan and Q-Q plots directly from PLINK2 association output file or any data frame with columns containing chromosomal name, chromosomal position, P-value and optionally the name of SNP(e.g. rsID in dbSNP).
The github repo: https://github.com/ShujiaHuang/qmplot
And tutorial: https://nbviewer.jupyter.org/url/github.com/ShujiaHuang/qmplot/blob/main/docs/tutorial.ipynb