Entering edit mode

8.9 years ago
Zhenyu Zhang
★
1.2k
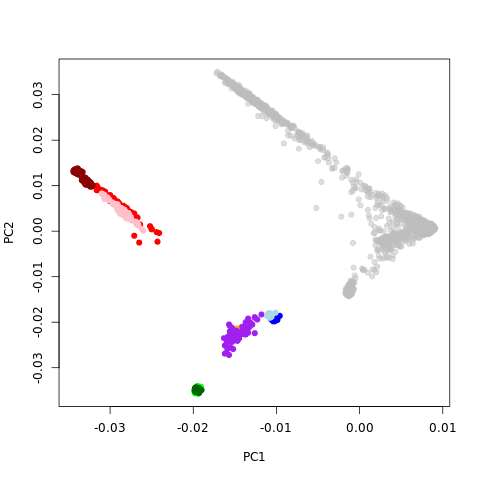
Help! I am doing some regular genotype population stratification using smartpca from EIGENSTRAT 5.01. The plot of PC2 ~ PC1 looks like the picture. The color ones are hapmap (blue/lightblue: euro; greenish: asian; redish: blacks; purple: mexican). The grey ones are my samples. There is a shift of coordinates, which indicates something wrong. Does anyone have any idea about the problem?
Details of what I did: I got my sample genotypes, merge with hapmap ones. There are some snp with strand flips, and I have tried both flip or just filter out. Also I have tried to whether remove long-range LD regions; whether to prune local LD SNPs, etc. No matter how I do it, the figure looks like this.
might be some kind of batch effect in your samples that is driving the PCA
Could the problem be the hapmap is with grch36, and mine sample with grch37?
I did the merge by their rs names, so I initially thought it's not an issue.