Hi Kevin, I think a have to ask again. I tried out zFPKM on my data, but when looking at the distributions I am afraid it does not have the quality I was expecting. This is how I retransformed the data: I retransformed the log2-transformed expression values and removed 0.1 from each expression (excerpt from the original study: "...adding to each expression measurement 0.1 FPKM, performing a log2 transformation."). I then applied zFPKM and filtered genes with an absolute zScore > 3 in more than 70% of the samples.
#retransform to zFPKM scores
  exp.fpkm <- 2^expr
  exp.fpkm.original <- exp.fpkm - 0.1
  exp.zfpkm <- zFPKM(exp.fpkm.original)

  #filter out lowly expressed genes
  thres <- (ncol(exp.zfpkm) * 30) / 100
  #filter all expression values that have absolute zfpkm score above 3.0 in more than 70% of the samples
  expr.zfpkm.filtered <- exp.zfpkm[(rowSums(abs(exp.zfpkm) > 3.0)) > thres, ]
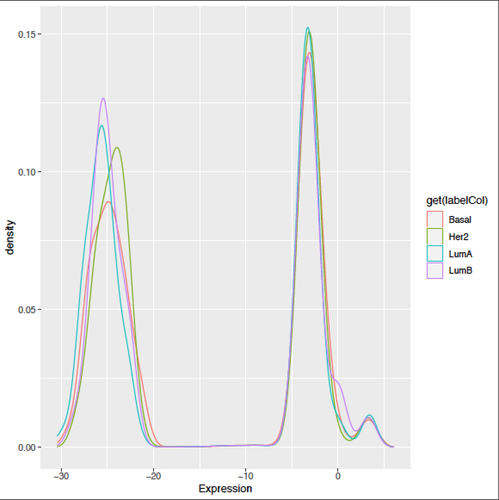
As a result quite many of the genes are filtered out, leaving me with roughly 4.5k genes (I would think this is too few). Having a look at the distributions, I am also somewhat sceptical that the data has the right quality:
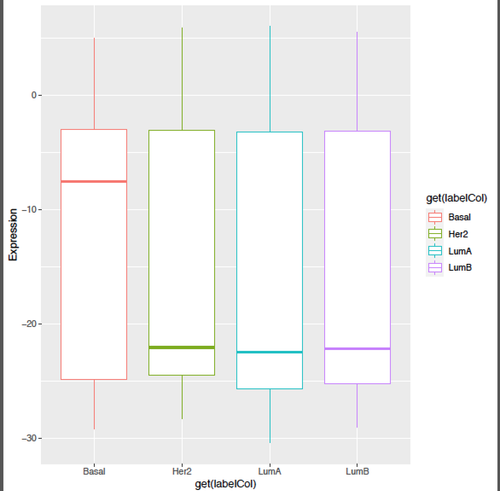
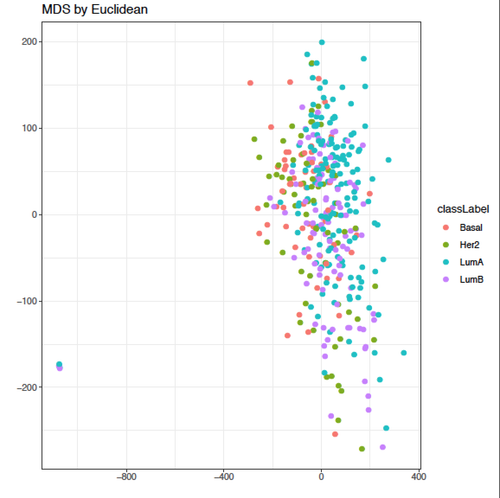
This is how the densities look like after filtering:
No, raw counts are not available (that's exactly my problem). There is a file called "GSE81538_gene_expression_405_transformed.csv" but it does not look like raw counts to me, so I have no idea at what point in the analysis this file was generated.
According to the study, that is how they preprocessed the data:
Here is an excerpt from GSE81538_gene_expression_405_transformed.csv:
Best,
Cindy
Kevin, thanks a lot for your helpful input!
I had thought of the same regarding FPKM-UQ, but when researching about the TCGA method, it looked as if the upper quartile normalisation was carried out during the FPKM normalisation (see here: https://docs.gdc.cancer.gov/Encyclopedia/pages/HTSeq-FPKM-UQ/):
Besides that, I had not found any other resource stating that it is ok to carry out upper quartile normalization on top of FPKM (so I was a bit unsure about that).
Best
Cindy
Why not just convert FPKMs to TPMs?